

Pan-tumor analysis to investigate the obesity paradox in immune checkpoint blockade
- PMID: 39832896
- PMCID: PMC11748946
- DOI: 10.1136/jitc-2024-009734
Pan-tumor analysis to investigate the obesity paradox in immune checkpoint blockade
Abstract
Background: Obesity is a risk factor for developing cancer but is also associated with improved outcomes after treatment with immune checkpoint inhibitors (ICIs), a phenomenon called the obesity paradox. To interrogate mechanisms of divergent immune responses in obese and non-obese patients, we examined the relationship among obesity status, clinical responses, and immune profiles from a diverse, pan-tumor cohort of patients treated with ICI-based therapy.
Methods: From June 2021 to March 2023, we prospectively collected serial peripheral blood samples from patients with advanced or metastatic solid tumors who received ICI as standard of care at Johns Hopkins. Patients were stratified by obesity status at treatment initiation, with obesity defined as body mass index (BMI)≥30 at treatment initiation and BMI≥18.5 and <30 considered non-obese; underweight patients (BMI<18.5) were excluded. We evaluated the concentration of 37 cytokines and used cytometry by time of flight to characterize immune cell clusters and cell-surface expression markers at baseline and on-treatment.
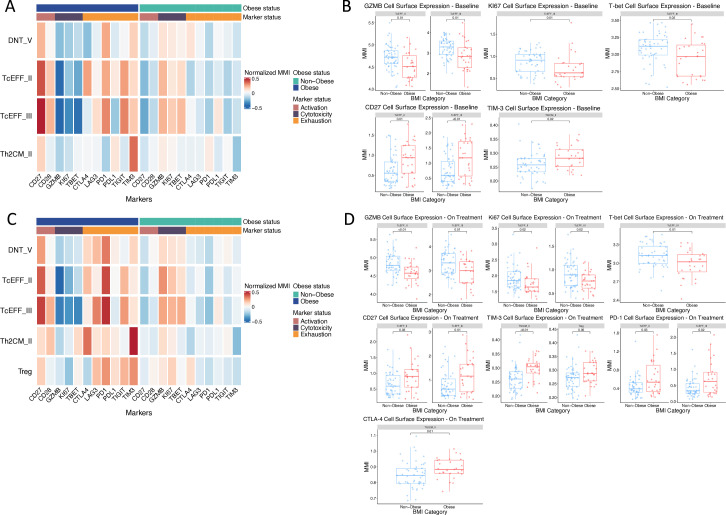
Results: We enrolled 94 patients, of whom 30 (32%) were obese and 64 (68%) were non-obese. Compared with non-obese patients, obese patients had superior progression-free survival (HR: 0.44 (95% CI: 0.24 to 0.81), p=0.01) and overall survival (OS) (HR: 0.24 (95% CI: 0.07 to 0.80), p=0.02). Obese patients had lower serum IL-15 levels at treatment baseline and lower on-treatment levels of IL-6, IL-8, and IL-15. Low on-treatment IL-6 was associated with improved OS (HR: 0.27 (95% CI: 0.08 to 0.88), p=0.03), as was low on-treatment IL-8 (HR: 0.19 (95% CI: 0.05 to 0.70), p=0.01). Obese patients demonstrated lower levels of T effector cells with reduced expression of cytotoxicity markers and higher expression of exhaustion markers at baseline and on-treatment.
Conclusions: Obese and non-obese patients with cancer have divergent immunological responses to ICIs. Obesity is associated with reduced levels of certain inhibitory cytokines and higher expression of T-cell exhaustion markers. ICI-based therapy may more effectively reverse T-cell dysfunction in obese patients, potentially contributing to the paradoxically improved responses in this population.
Keywords: Cytokine; Immune Checkpoint Inhibitor; Immunotherapy; Solid tumor; T cell.
© Author(s) (or their employer(s)) 2025. Re-use permitted under CC BY-NC. No commercial re-use. See rights and permissions. Published by BMJ.
Conflict of interest statement
Competing interests: SSS reports travel honoraria from Standard BioTools. EJL reports funding from the Marilyn and Michael Glosserman Fund for Basal Cell Carcinoma and Melanoma Research, Bloomberg∼Kimmel Institute for Cancer Immunotherapy, Moving for Melanoma of Delaware, the Barney Family Foundation, the Laverna Hahn Charitable Trust, and the Julie Ann Robertson Cashour Memorial Fund outside the submitted work. RGH, GSC, and RM are employees of F. Hoffman-La Roche, and AG, SB, and LT are employees of Genentech. EMJ reports other support from AbMeta, other support from Adventris, personal fees from Achilles, personal fees from DragonFly, non-financial support from Parker Institute, personal fees from Surge, grants from Lustgarten, grants from Genentech, personal fees from Mestag, personal fees from Medical Home Group, non-financial support from BMS, grants from Break Through Cancer, personal fees from CPRIT, personal fees from Neuvogen, non-financial support from HDT Bio, and personal fees from NeoTX outside the submitted work. WJH reports support from NIH/NCI P30CA006973 and NIH/NCI R21CA264004, as well as patent royalties from Rodeo/Amgen, received grants from Sanofi and NeoTX (to Johns Hopkins), and speaking/travel honoraria from Exelixis and Standard BioTools. MY reports research funding (to Johns Hopkins) from Genentech, Bristol-Myers Squibb, and Incyte; consulting fees from Genentech, Exelixis, Eisai, AstraZeneca, Replimune, Hepion, and Lantheus; and equity in Adventris. The other authors declare no competing interests.
Figures


References
-
- World Health Organization Obesity and overweight. 2024. [10-Mar-2024]. https://www.who.int/news-room/fact-sheets/detail/obesity-and-overweight Available. Accessed.
-
- Fryar CD, Carroll MD, Afful J. Health E-Stats; 2021. [10-Mar-2024]. Prevalence of overweight, obesity, and severe obesity among adults aged 20 and over: united states, 1960–1962 through 2017–2018.https://www.cdc.gov/nchs/data/hestat/obesity-adult-17-18/obesity-adult.htm Available. Accessed.
MeSH terms
Substances
Grants and funding
LinkOut - more resources
Full Text Sources
Medical