Unveiling pelagic-benthic coupling associated with the biological carbon pump in the Fram Strait (Arctic Ocean)
- PMID: 39833152
- PMCID: PMC11747630
- DOI: 10.1038/s41467-024-55221-x
Unveiling pelagic-benthic coupling associated with the biological carbon pump in the Fram Strait (Arctic Ocean)
Abstract
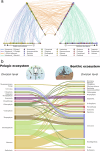
Settling aggregates transport organic matter from the ocean surface to the deep sea and seafloor. Though plankton communities impact carbon export, how specific organisms and their interactions affect export efficiency is unknown. Looking at 15 years of eDNA sequences (18S-V4) from settling and sedimented organic matter in the Fram Strait, here we observe that most phylogenetic groups were transferred from pelagic to benthic ecosystems. Chaetoceros socialis, sea-ice diatoms, Radiolaria, and Chaetognatha are critical components of vertical carbon flux to 200 m depth. In contrast, the diatom C. socialis alone is essential for the amount of organic carbon reaching the seafloor. Spatiotemporal changes in community composition show decreasing diatom abundance during warm anomalies, which would reduce the efficiency of a diatom-driven biological carbon pump. Interestingly, several parasites are also tightly associated with carbon flux and show a strong vertical connectivity, suggesting a potential role in sedimentation processes involving their hosts, especially through interactions with resting spores, which could have implications for pelagic-benthic coupling and overall ecosystem functioning.
© 2025. The Author(s).
Conflict of interest statement
Competing interests: The authors declare no competing interests.
Figures


Similar articles
-
Sea ice presence is linked to higher carbon export and vertical microbial connectivity in the Eurasian Arctic Ocean.Commun Biol. 2021 Nov 3;4(1):1255. doi: 10.1038/s42003-021-02776-w. Commun Biol. 2021. PMID: 34732822 Free PMC article.
-
Patchy Blooms and Multifarious Ecotypes of Labyrinthulomycetes Protists and Their Implication in Vertical Carbon Export in the Pelagic Eastern Indian Ocean.Microbiol Spectr. 2022 Jun 29;10(3):e0014422. doi: 10.1128/spectrum.00144-22. Epub 2022 May 3. Microbiol Spectr. 2022. PMID: 35502912 Free PMC article.
-
Does Arctic warming reduce preservation of organic matter in Barents Sea sediments?Philos Trans A Math Phys Eng Sci. 2020 Oct 2;378(2181):20190364. doi: 10.1098/rsta.2019.0364. Epub 2020 Aug 31. Philos Trans A Math Phys Eng Sci. 2020. PMID: 32862811 Free PMC article.
-
Mechanisms and Pathways of Small-Phytoplankton Export from the Surface Ocean.Ann Rev Mar Sci. 2019 Jan 3;11:57-74. doi: 10.1146/annurev-marine-121916-063627. Epub 2018 Jul 11. Ann Rev Mar Sci. 2019. PMID: 29996063 Review.
-
Shifting patterns of life in the Pacific Arctic and sub-Arctic seas.Ann Rev Mar Sci. 2012;4:63-78. doi: 10.1146/annurev-marine-120710-100926. Ann Rev Mar Sci. 2012. PMID: 22457969 Review.
References
-
- Barnes, D. K. & Tarling, G. A. Polar oceans in a changing climate. Curr. Biol.27, R454–R460 (2017). - PubMed
-
- Meredith M. et al. Polar Regions. Chapter 3, IPCC Special Report on the Ocean and Cryosphere in a Changing Climate. (2019).
-
- DeVries T., Primeau F., Deutsch C. The sequestration efficiency of the biological pump. Geophys. Res. Lett.39, 13601 (2012).
-
- Nowicki, M., DeVries, T. & Siegel, D. A. Quantifying the carbon export and sequestration pathways of the ocean’s biological carbon pump. Glob. Biogeochem. Cycles36, e2021GB007083 (2022).
MeSH terms
Substances
Grants and funding
LinkOut - more resources
Full Text Sources

