. 2025 Jan 20;16(1):843.
doi: 10.1038/s41467-025-56086-4.

A dual role of Cohesin in DNA DSB repair

Affiliations

A dual role of Cohesin in DNA DSB repair

Michael Fedkenheuer et al. Nat Commun. .

Abstract

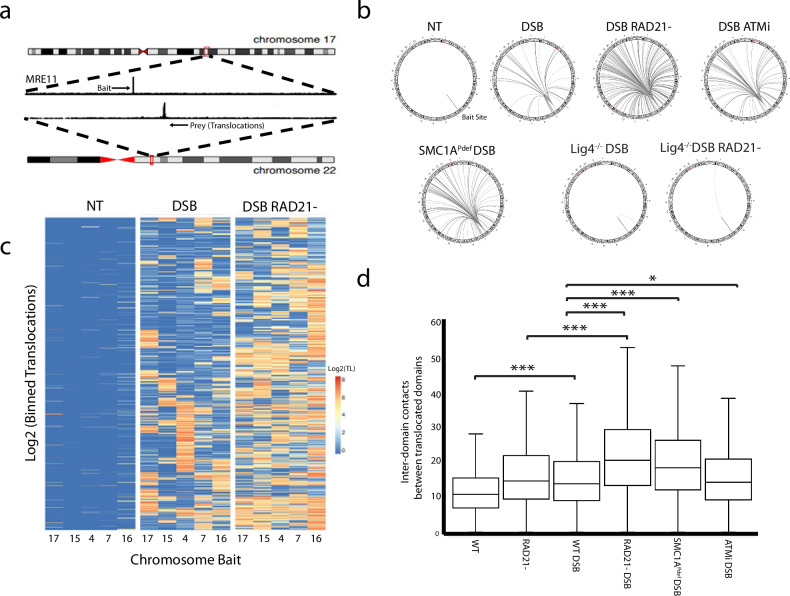
Cells undergo tens of thousands of DNA-damaging events each day. Defects in repairing double-stranded breaks (DSBs) can lead to genomic instability, contributing to cancer, genetic disorders, immunological diseases, and developmental defects. Cohesin, a multi-subunit protein complex, plays a crucial role in both chromosome organization and DNA repair by creating architectural loops through chromatin extrusion. However, the mechanisms by which cohesin regulates these distinct processes are not fully understood. In this study, we identify two separate roles for cohesin in DNA repair within mammalian cells. First, cohesin serves as an intrinsic architectural factor that normally prevents interactions between damaged chromatin. Second, cohesin has an architecture-independent role triggered by ATM phosphorylation of SMC1, which enhances the efficiency of repair. Our findings suggest that these two functions work together to reduce the occurrence of translocations and deletions associated with non-homologous end joining, thereby maintaining genomic stability.


Conflict of interest statement

Competing interests: The authors declare no competing interests.

Figures

Fig. 1
Fig. 1. Cohesin does not bind directly at DSBs, rather it accumulates in a phosphorylation dependent manner throughout damaged chromatin domains.
HCT116 cells containing inducible AsiSI were incubated with 4-hydroxytamoxifen (4OHT) to induce DNA damage. RAD21 ChIP-seq and HiC were performed in combination with MRE11 ChIP-seq to identify AsiSI DSBs. a Immunofluorescence (IF) staining 6 h after induction of AsiSI. The leftmost panel shows negative control untreated cells stained with γH2AX to compare with 4OHT treated cells in the middle (γH2AX-red) and right (RAD21-green) panels. RAD21 enrichment at γH2AX foci was observed. b ChIPseq was used to measure RAD21 enrichement at peaks around DSBs for WT cells ≤10 kb (n = 73, P = 0.003), ≤ 250 kb (n = 765, P = 5E-11), ≤1 Mb (n = 1921, P = 0.01) versus control chromatin >1 Mb (n = 28,538). ATM inhibited cells showed less significant loading around the break (P = 0.04, P = 0.002, and P = 0.5, respectively, for ≤ 10 kb, 250 kb, and 1 Mb vs. >1 Mb control). The number of asterisks assigned to a given item indicate the level of significance *P < 0.05, *P < 0.01 ***P < 0.001 (two sample, paired; T-test). Box plot parameters: The lower and upper limits of the boxes in the plot represent the 25th and the 75th quartiles, respectively. The central horizontal line represents the median, while each whiskers represent one interquartile range (IQR) defined by Q3-Q1. The data shown are from biological replicate. c Genomic view of a DNA DSB marked by MRE11 and γH2AX. The γH2AX domain is magnified to examine changes in RAD21 binding in damaged (red) and undamaged cells (black). Low-intensity binding sites not marked as anchors are NIPBL loading sites. d Cohesin anchor sites were determined by colocalization of RAD21 and CTCF. Enrichment of RAD21 peaks at anchor sites within damaged chromain domains was measured for WT (n = 1467, P = 0.002), LIG4-/- (n = 1055, P < 1E-16) SMC1APdef (n = 1478, P = 0.02) by comparing enrichment inside versus outside of γH2AX domains. Box plot and statistical parameters, as well as replicate information, are the same as panel b. e RAD21 (green) and γH2AX (red) observed in cells fixed 45 minutes post DSB induction with a UV laser. The yellow boxes indicate the area exposed to the UV laser. f Cohesin recruitment to DSBs was measured by live cell imaging over 1 hour for WT, ATMi treated, and SMC1APdef cells (n = 25 per condition). Error bars represent the Standard Deviation (SD) between treated cells. Source data for all panels are provided as a Source Data file.
Fig. 2
Fig. 2. Cohesin phosphorylation increases rate of repair but not contact frequency.
a Intra-domain interactions were measured for γH2AX domains and control domains not containing AsiSI breaks. Comparisons between damaged chromatin domains (n = 62) were made for WT versus RAD21- (P < 1E-16), SMC1APdef (P = 0.06), and ATMi (P = 3E-5). The same comparisons were made between undamaged control domains (n = 3425) for the same categories respectively (P < 1E-16, 0.06, 0.4) The number of asterisks assigned to a given item indicate the level of significance *P < 0.05, *P < 0.01 ***P < 0.001 (one tailed, paired; T-test). Observed/Expected (O/E) values were used to normalize experimental conditions. Data from two biological replicates was merged to produce this plot. Box plot parameters: The lower and upper limits of the boxes in the plot represent the 25th and the 75th quartiles respectively. The central horizontal line represents the median, while each whiskers represent one IQR. Outlying points are not shown. b Inter-domain interactions between intrachromosomal DSB-DSB domain pairs (n = 159, left panel) and Ctrl-Ctrl domain pairs (n = 159, right panel) were calculated between DSB/NT. DSB-DSB domains were compared between WT and RAD21- (P = 1E-6), SMC1APdef (P = 0.2), and ATMi (P = 0.7). The same comparisons were made for Ctrl-Ctrl domains respectively (P = 5E-4, 0.1, 0.08). Box plot, statistical parameters, O/E normalization, and replicate information are the same as panel a. c HCT116 cells were treated with 2.5 Gy γ-irradiation and fixed at the timepoints designed to capture the entire DNA repair process. Immunofluorescence was performed for γH2AX and foci were imaged to measure the appearance and dissolution of foci. γH2AX foci were measured for WT, RAD21- and SMC1APdef cells at 0 h (n = 177, 174, 196), 1 h (n = 432, 358, 410), 3 h (n = 334, 260, 461), 5 h (n = 324, 291, 141), and 8 h (n = 304, 268, 269) post-treatment with 2.5 Gy γ-irradiation. Images were taken from three biological replicates and pooled. Box plot and statistical parameters are the same as described in panel a. d Representative images from comet assays performed under neutral conditions are shown at 1 h and 4 h post-treatment with 12.5 Gy γ-irradiation, showing delayed repair of DNA in RAD21- and SMC1APdef cells indicated by the migration of fragmented DNA (comet tail) at 4 h post-irradiation which is absent from WT. e Comet tail lengths were quantified from one of three biological replicate (n = 25 per condition). WT was compared to RAD21- and SMC1APef at 1 h (P = 1E-13, 2E-8) and 4 h (P = 1E-17, 2E-11) post γ-irradiation indicating defective repair. Replicates varied in intensity, but trends remained the same between backgrounds. Box plot parameter and statistical parameters are the same as panel a. Source data for all panels are provided as a Source Data file.
Fig. 3
Fig. 3. Cohesin depletion and SMC1APdef cells were compared to identify the proportion of cis-deletions derived from defects in genome architecture versus delayed repair.
a A representative example of cis-recombination measured by qPCR. Blue arrows indicate primers used to amplify the expected deletion. MRE11 ChIPseq peaks were referenced to identify consistent AsiSI DSBs pairs used for screening for deletion junctions. b HCT116 cells containing inducible AsiSI and RAD21-degron systems were induced for DNA damage and/or RAD21 depletion for 72 h. Six break pair junctions were measured by qPCR in the RAD21- and SMC1APdef backgrounds. Dots represent biological replicates which were derived from the average of three technical replicates. Error bars represent SD between replicates. The number of asterisks assigned to a given item indicate the level of significance *P < 0.05, *P < 0.01 ***P < 0.001 (one tailed, paired; T-test). c All junctions were averaged to provide a global view of deletions between all baits in WT versus RAD21- (P = 2E-8) and SMC1APdef (P = 0.002) cells. Each dot represents a junction sites (n = 6), while error bars represent SD between junction sites for a given condition. Statistical parameters are the same as panel b. Source data for all panels are provided as a Source Data file.
Fig. 4
Fig. 4. The architectural and repair roles of cohesin function synergistically to promote error free repair during NHEJ. HCT116 cells were induced for AsISI DNA damage in the presence or absence of RAD21 for 72 h prior to High Throughput Genome Translocation Sequencing (HTGTS).
a An example translocation from a bait site (AsiSI break) on Chr17 to a prey site on Chr22 (AsiSI break) using HTGTS. b Circos plots were used to show the most prevalent translocation sites (≥ 600 unique events) for Bait 4 (chr7) for all experimental conditions. c Heatmaps were generated to illustrate the consistency of increased translocations produced by cohesin depletion across all bait sites. d Increased inter-chromosomal interactions between translocated sites (n = 2526) were observed for undamaged and damaged sites specific to DSB induction (P < 1E-16 WT v WTDSB, P < 1E-16 RAD21- v. RAD21-DSB). Among DSB-induced conditions, an increase in intensity was observed at translocated sites for RAD21-, SMC1APdef, and ATMi treated cells versus WT (P < 1E-16, P < 1E-16, P = 0.05, respectively). The number of asterisks assigned to a given item indicate the level of significance *P < 0.05, *P < 0.01 ***P < 0.001 (one tailed, paired; T-test). Box plot parameters: The lower and upper limits of the boxes in the plot represent the 25th and the 75th quartiles respectively. The central line represents the median, while each whiskers represent one IQR. Source data for all panels are provided as a Source Data file.

References

    1. Tubbs, A. & Nussenzweig, A. Endogenous DNA Damage as a Source of Genomic Instability in Cancer. Cell168, 644–656 (2017). - PMC - PubMed
    1. Vilenchik, M. M. & Knudson, A. G. Endogenous DNA double-strand breaks: production, fidelity of repair, and induction of cancer. Proc. Natl Acad. Sci. USA100, 12871–12876 (2003). - PMC - PubMed
    1. Jackson, S. P. & Bartek, J. The DNA-damage response in human biology and disease. Nature461, 1071–1078 (2009). - PMC - PubMed
    1. Basu, A. K. DNA Damage, Mutagenesis and Cancer. Int. J. Mol. Sci.19 (2018). - PMC - PubMed
    1. Curtin, N. J. DNA repair dysregulation from cancer driver to therapeutic target. Nat. Rev. Cancer12, 801–817 (2012). - PubMed

MeSH terms

LinkOut - more resources