. 2025 Jan 20;16(1):867.
doi: 10.1038/s41467-025-56344-5.

Palmitoylation-dependent regulation of GPX4 suppresses ferroptosis

Affiliations

Palmitoylation-dependent regulation of GPX4 suppresses ferroptosis

Bin Huang et al. Nat Commun. .

Abstract

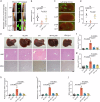
S-palmitoylation is a reversible and widespread post-translational modification, but its role in the regulation of ferroptosis has been poorly understood. Here, we elucidate that GPX4, an essential regulator of ferroptosis, is reversibly palmitoylated on cysteine 66. The acyltransferase ZDHHC20 palmitoylates GPX4 and increases its protein stability. ZDHHC20 depletion or inhibition of protein palmitoylation by 2-BP sensitizes cancer cells to ferroptosis. Moreover, we identify APT2 as the depalmitoylase of GPX4. Genetic silencing or pharmacological inhibition of APT2 with ML349 increases GPX4 palmitoylation, thereby stabilizing the protein and conferring resistance to ferroptosis. Notably, disrupting GPX4 palmitoylation markedly potentiates ferroptosis in xenografted and orthotopically implanted tumor models, and inhibits tumor metastasis through blood vessels. In the chemically induced colorectal cancer model, knockout of APT2 significantly aggravates cancer progression. Furthermore, pharmacologically modulating GPX4 palmitoylation impacts liver ischemia-reperfusion injury. Overall, our findings uncover the intricate network regulating GPX4 palmitoylation, highlighting its pivotal role in modulating ferroptosis sensitivity.


Conflict of interest statement

Competing interests: The authors declare no competing interests.

Figures
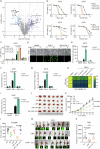
Fig. 1
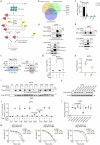
Fig. 1. Identification of 2-BP as a potent contributor to ferroptosis.
a Volcano plot showing ferroptotic cell death changes in A375 cells treated with ~3200 metabolism-focused small molecules for 24 h, followed by 24 h RSL3 treatment. b Cell viability analysis in A375 cells pre-treated with 2-BP for 24 h, followed by 48 h treatment with GPX4 inhibitors (RSL3, ML162, ML210) and SLC7A11 inhibitor (erastin). c Cell viability analysis of A375 cells pre-treated with 2-BP for 24 h, followed by 48 h cystine starvation-induced ferroptosis, with or without Fer-1 (2 μM). Phase contrast and fluorescence images (d) and quantitative analysis of SYTOX Green-stained dead cells (e) in A375 cells pre-treated with 2-BP for 24 h, followed by 6 h RSL3 (4 μM) treatment, with or without Fer-1 (2 μM). Scale bar, 100 μm. f Lipid peroxidation analysis in A375 cells pre-treated with 2-BP for 24 h, followed by RSL3 (4 μM) treatment for 6 h, with or without Fer-1 (2 μM). g PTGS2 mRNA level detection in A375 cells pre-treated with 2-BP for 24 h, then treated with RSL3 (4 μM) for 6 h, with or without Fer-1 (2 μM). h Heatmap of cell viability in A375 cells pretreated with 2-BP for 24 h, followed by 24 h RSL3 (1 μM) treatment with various inhibitors, including z-VAD-fmk (20 μM), necrostatin-1 (2 μM), Bafilomycin A1 (10 nM), and Fer-1 (1 μM). i ROS quantification in A375 cells pretreated with 2-BP for 24 h, followed by 6 h RSL3 treatment using CM-H2DCFDA probe. Xenograft experiment with subcutaneously inoculated A375 cells in nude mice treated with IKE (20 mg/kg), 2-BP (20 mg/kg), a combination of IKE (20 mg/kg) and 2-BP (20 mg/kg), and a combination of IKE (20 mg/kg), 2-BP (20 mg/kg), and Lip-1 (10 mg/kg) (i.p., once every two days) for two weeks. Measurements include dissected tumors (j), growth curve (k), and tumor weight (l). n = 6. m, n Orthotopic xenograft tumors from RKO cells transplanted into the cecum of nude mice, treated with 2-BP (20 mg/kg) and a combination of 2-BP and Lip-1 (i.p., once every three days). Tumor volume indicated by fluorescence intensity. n = 8. Scale bar, 2 cm. Data are presented as mean ± SD. Statistical analyses: two-way ANOVA with Tukey’s multiple comparisons test for (c, eg, i); one-way ANOVA with Tukey’s multiple comparisons test for (a, b, k, l, n). Sample sizes: (ac, ei) n = 3 independent experiments; (jl) n = 6 individual mice; (m, n) n = 8 individual mice. Image in d shows representative results from three independent experiments. ns not significant.
Fig. 2
Fig. 2. GPX4 is palmitoylated at Cys 66.
a Schematic of the workflow for identifying palmitoylated proteins using the click chemistry assay and LC-MS/MS. b Mass spectrometry results from three independent samples were used to identify palmitoylated proteins. The numbers in the figure represent the palmitoylated proteins identified in each sample (with proteins identified in the HAM group excluded). c Peptide spectral counts for GPX4 in control and 2-BP treated groups, with and without HAM. Palmitoylation analysis of Flag-GPX4 in A375 (d) and 293T (e) cells using the ABE assay, with and without HAM. fh Palmitoylation of Flag-GPX4 in A375 cells pre-treated with 2-BP and incubated with Alk14, analyzed using the click chemistry assay with and without HAM (f). Quantitative analysis of GPX4 palmitoylation (g) and total GPX4 levels (h). i, j Palmitoylation analysis of exogenous GPX4 and its mutants in A375 cells using the ABE assay with and without HAM (i). Quantitative analysis of GPX4 palmitoylation (j). Immunoblot detection (k) and quantification (l) of GPX4 in A375 cells infected with Flag-GPX4-WT or mutant constructs. m Cell viability analysis in A375-GPX4-KO cells infected with WT or mutant Flag-GPX4 constructs, pre-treated with 2-BP, and then treated with RSL3. Data are presented as mean ± SD. Statistical analysis: two-way ANOVA with Tukey’s test for (c, j); one-way ANOVA with Tukey’s test for (g, h, l). Sample sizes: (c, g, h, j, l, m) n = 3 independent experiments. Image in d, e, f, i, k shows representative results from three independent experiments.
Fig. 3
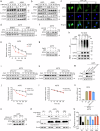
Fig. 3. GPX4 palmitoylation regulates protein stability.
Immunoblots of GPX4, FSP1, SLC7A11, and ACSL4 in A375 and A549 cells treated with varying concentrations of 2-BP (a) and at different time points (b). c Immunofluorescence staining of GPX4 in A375 cells treated with 2-BP for 48 h. Scale bar, 10 μm. d, e Immunoblots of GPX4 in A375 cells pre-treated with 2-BP for 24 h, followed by cycloheximide (CHX) treatment for indicated times (d). Quantification of GPX4 protein levels (e). f GPX4 detected by immunoblots in A375 cells pre-treated with 2-BP for 24 h, followed by 12 h proteasome inhibitor MG132 treatment. g GPX4 detected by immunoblots in A375 cells pre-treated with 2-BP for 24 h, followed by 12 h lysosome inhibitor BafA1 treatment. h Immunoblots were performed on A375 cells that were pre-treated with 2-BP for 12 h, followed by the addition of 10 μM MG132 for an additional 12 h, after which GPX4 was pulled down using an anti-GPX4 antibody. i, j Immunoblots of GPX4 in A375 cells infected with Flag-GPX4-WT or Flag-GPX4-C66S, followed by CHX treatment for indicated times (i). Quantification of GPX4 protein levels (j). k, l Immunoblots of GPX4 in A375 cells infected with Flag-GPX4-WT or Flag-GPX4-C75S, followed by CHX treatment for indicated times (k). Quantification of GPX4 protein levels (l). GPX4 protein levels detected by immunoblots (m) and relative mRNA levels by RT-qPCR (n) in A375 cells infected with various GPX4 constructs. o GPX4 detected by immunoblots in A375 cells infected with Flag-GPX4-WT or Flag-GPX4-C66S, treated with or without MG132 for 12 h. p, q Immunoblots of GPX4 in A375 cells infected with various GPX4 constructs, followed by 48 h 2-BP treatment (p). Quantification of GPX4 protein levels (q). Data are presented as mean ± SD. Statistical analysis: two-way ANOVA with Tukey’s test for (q); one-way ANOVA with Tukey’s test for (e, j, l, n). Sample sizes: (e, j, l, n, q) n = 3 independent experiments. Image in ad, fi, k, m, o, p shows representative results from three independent experiments.
Fig. 4
Fig. 4. ZDHHC20 is the palmitoyl acyltransferase of GPX4.
a Palmitoylation of GPX4 in 293T cells expressing Flag-GPX4 and transfected with either empty vector or HA–DHHC plasmids, incubated with 50 μM Alk14 for 12 h, determined using the click chemistry assay. b Co-immunoprecipitation in 293T cells transiently transfected with Flag-GPX4 and HA-ZDHHC20 plasmids to investigate ZDHHC20-GPX4 interaction, with GPX4 and ZDHHC20 detection by immunoblots. RT-qPCR analysis of ZDHHC20 (c) and GPX4 (d) mRNA levels in A375 cells infected with lentiviruses encoding control shRNA or ZDHHC20 shRNA. e GPX4 palmitoylation in A375 cells infected with lentiviruses encoding control shRNA or ZDHHC20 shRNA, and incubated with 50 μM Alk14 for 12 h, determined using the click chemistry assay. f GPX4 palmitoylation in A375 cells infected with lentiviruses encoding HA-empty vector, HA-ZDHHC20 or HA-ZDHHC20-C156S and incubated with 50 μM Alk14 for 12 h, determined using the click chemistry assay. g Cell viability analysis in A375 cells infected with lentiviruses encoding control shRNA or ZDHHC20 shRNA, followed by 48 h RSL3 treatment. h Immunoblots of GPX4 and ZDHHC20 in A375 cells infected with lentiviruses encoding empty vector or ZDHHC20. i Cell viability analysis in A375 cells infected with lentiviruses encoding empty vector or ZDHHC20, followed by 24 h RSL3 treatment. j Immunofluorescence staining for GPX4 and ZDHHC20 was performed in A375 cells infected with lentiviruses encoding a control plasmid or an HA-ZDHHC20 plasmid. Scale bar, 4 μm. k Analysis of the correlation between ZDHHC20 gene expression and ferroptosis sensitivity to RSL3, ML162 and ML210 using the CTRP database (https://portals.broadinstitute.org/ctrp.v2.1/). ZDHHC20 was correlated with resistance to RSL3 (P = 0.139), ML162 (P = 0.135) and ML210 (P = 0.154) according to their Pearson correlation score. “In Fig. 4k, the box plot is presented to illustrate the correlation between the sensitivity of [860 cancer cell lines to 481 compounds] and [different levels of ZDHHC20 gene expression]. The central box extends from the lower quartile (-1, Q1, 25th percentile) to the upper quartile (1, Q3, 75th percentile), indicating the interquartile range (2, IQR), which contains the middle 50% of the data. The median (0, Q2, 50th percentile) is represented by a line inside the box, dividing the data into two halves. The whiskers extend from the edges of the box to the minimum and maximum data points within a certain range, typically 1.5 times the IQR, unless there are outliers. Outliers are data points that fall outside the range of -3 to 3 and are plotted as individual points marked by circles. Data are presented as mean ± SD. Statistical analysis: one-way ANOVA with Tukey’s test for (c, d). Sample sizes: (c, d, g, i) n = 3 independent experiments. k n = 860 cancer cell lines. Image in a, b, e, f, h, j shows representative results from three independent experiments.
Fig. 5
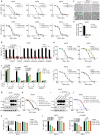
Fig. 5. APT2 mediates the depalmitoylation of GPX4.
a Analysis of proteins interacting with GPX4 in A375 and 293T cells infected with lentiviruses encoding empty vector or Flag-GPX4, using anti-Flag magnetic beads enrichment and LC-MS/MS. b Co-immunoprecipitation in 293T cells transiently transfected with Flag-GPX4 and HA-APT2 plasmids to investigate GPX4-APT2 interaction detected by immunoblots. c Immunofluorescence staining for GPX4 and APT2 was performed in A375 cells infected with lentiviruses encoding a control plasmid or an HA-APT2 plasmid. Scale bar, 4 μm. d Palmitoylation analysis of exogenous GPX4 in A375 cells infected with lentiviruses encoding control or APT2 shRNA, using the ABE assay with or without HAM. e Immunoblots of APT2, GPX4, SLC7A11, and ACSL4 in A375 and HT1080 cells infected with lentiviruses encoding control or APT2 shRNA. f RT-qPCR detection of GPX4 mRNA levels in A375 and HT1080 cells infected with lentiviruses encoding control or APT2 shRNA. g Immunoblots of GPX4, FSP1, SLC7A11, and ACSL4 in A375, HT1080, and A549 cells treated with ML349 at indicated concentrations. h RT-qPCR analysis of GPX4 mRNA levels in A375 cells treated with ML349 at indicated concentrations. i, j Immunoblots of GPX4 and APT2 in A375 cells infected with lentiviruses encoding control or APT2 shRNA, treated with CHX for indicated times (i). Quantification of GPX4 protein levels (j). Data are presented as mean ± SD. Statistical analysis: two-way ANOVA with Tukey’s test for (j); one-way ANOVA with Tukey’s test for (f, h). Sample sizes: (f, h, j) n = 3 independent experiments. Image in b, c, d, e, g, i shows representative results from three independent experiments.
Fig. 6
Fig. 6. Inhibition of APT2 suppresses ferroptosis.
a Cell viability analysis in A375 cells infected with lentiviruses encoding control, APT1, APT2, ABHD17A, ABHD17B, ABHD17C, and ABHD10 shRNA, followed by 48 h RSL3 treatment. b Cell death analysis in A375 cells infected with lentiviruses encoding control or depalmitoylase shRNAs, treated with RSL3 (4 μM) for 6 h, with or without Fer-1 (2 μM). Phase contrast and fluorescence images (c) and quantitative analysis of dead cells stained with SYTOX Green (d) in A375 cells infected with control or APT2 shRNA and treated with RSL3 (4 μM) for 6 h. Scale bar, 20 μm. e Cell viability analysis in A375 cells pre-treated with ML348, ML349, Palm B, and ABHD957 for 24 h, followed by 48 h RSL3 treatment. f Cell death analysis in A375 cells pre-treated with 2-BP and various depalmitoylase inhibitors for 24 h, followed by RSL3 treatment for 48 h, with or without Fer-1. g Immunoblot confirmation of APT2 and GPX4 expression in A375 cells with APT2 knockdown, infected with HA-APT2 lentivirus. h Cell viability in A375 cells with APT2 knockdown, infected with HA-APT2 lentivirus, followed by 48 h RSL3 treatment. i Immunoblot confirmation of APT2 and GPX4 expression in A375 cells with APT2 knockdown, infected with lentiviruses encoding empty vector, HA-APT2, HA-APT2-C2S, or HA-APT2-S122A. j Cell viability analysis in A375 cells with APT2 knockdown, infected with lentiviruses encoding various HA-APT2 constructs, followed by 48 h RSL3 treatment. k Cell viability analysis in A375 cells infected with control or APT2 shRNA, pre-treated with 2-BP for 24 h, then treated with RSL3 for 48 h. l Cell viability analysis in A375 and HT1080 cells pre-treated with 2-BP and ML349 for 24 h, followed by 48 h RSL3 treatment. Data are presented as mean ± SD. Statistical analysis: two-way ANOVA with Tukey’s test for (b, f, k, l). Sample sizes: (a, b, df, h, jl) n = 3 independent experiments. Image in c, g, i shows representative results from three independent experiments. ns not significant.
Fig. 7
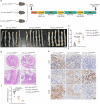
Fig. 7. APT2 ablation aggravates colon cancer development.
a Timeline of the AOM/DSS-induced colon cancer model in C57BL/6J transgenic mice. b Representative images of large intestine tumorigenesis in Vil1-Cre; APT2+/+, Vil1-Cre; APT2flox/+, and Vil1-Cre; APT2flox/flox mice. Scale bar, 10 μm. c Quantification of tumor numbers in the large intestine of Vil1-Cre; APT2+/+, Vil1-Cre; APT2flox/+, and Vil1-Cre; APT2flox/flox mice. d H&E staining of colorectal lesions induced by AOM/DSS in Vil1-Cre; APT2+/+, Vil1-Cre; APT2flox/+, and Vil1-Cre; APT2flox/flox mice. Scale bar, 1 mm and 100 μm. e IHC staining for APT2, GPX4, and 4-HNE in colorectal lesions induced by AOM/DSS in Vil1-Cre; APT2+/+, Vil1-Cre; APT2flox/+, and Vil1-Cre; APT2flox/flox mice. Scale bar, 10 μm. f Intensity scoring of 4-HNE staining in colorectal lesions induced by AOM/DSS in Vil1-Cre; APT2+/+, Vil1-Cre; APT2flox/+, and Vil1-Cre; APT2flox/flox mice. Data are presented as mean ± SD. Statistical analysis: one-way ANOVA with Tukey’s test for (c, f). Sample sizes: (c, f) n = 6 independent tumors. Image in d, e shows representative results from three independent experiments.
Fig. 8
Fig. 8. GPX4 palmitoylation and depalmitoylation regulate ferroptosis.
a, b Orthotopic xenograft tumors by transplanting RKO cells into the cecum of nude mice, treated with 2-BP (20 mg/kg, ip, every three days) and a combination of 2-BP and Lip-1 (20 mg/kg, ip, every three days). Representative image of distal metastatic tumors (a) and quantitative analysis of metastatic tumor numbers (b). n = 8 individual mice. Scale bar, 500 μm. c, d Nude mice pre-treated with 2-BP (20 mg/kg, ip, daily) and a combination of 2-BP and Lip-1 (20 mg/kg, ip, daily) for 3 days, followed by tail vein injection of 2 million A375-GFP cells and continued treatment for one week. Observation for lung metastatic tumor development three weeks later. Representative image of lung metastatic tumors (c) and quantitative analysis of metastatic tumor numbers (d). n = 6 individual mice. Scale bar, 500 μm. e C57BL/6J mice were intraperitoneally injected with ML349 (5 mg/kg) and Lip-1 (10 mg/kg) one hour before the induction of liver injury by ischemia-reperfusion. Representative images of the livers under different treatments, as well as the corresponding hematoxylin and eosin (HE) staining of the livers and immunohistochemical staining for MDA from liver tissues, are presented. n = 6 individual mice. Scale bar, 50 μm. f, g The analysis of serum alanine transaminase (ALT) and aspartate aminotransferase (AST) levels in C57BL/6J mice with liver injury induced by ischemia-reperfusion. h, i RT-qPCR analysis of the relative mRNA levels of Ptgs2 and Chac1 in liver tissue from C57BL/6J mice with liver injury induced by ischemia-reperfusion. j Quantitative analysis of MDA in liver tissue from C57BL/6J mice with liver injury induced by ischemia-reperfusion. Data are presented as mean ± SD. Statistical analysis: one-way ANOVA with Tukey’s test for (b, d, fj). Sample sizes: (a, b) n = 8; (c, d) n = 6; (ej) n = 6 individual mice. Image in a, c, e shows representative results from three independent experiments. ns not significant.

References

    1. Dixon, S. J. et al. Ferroptosis: an iron-dependent form of nonapoptotic cell death. Cell149, 1060–1072 (2012). - PMC - PubMed
    1. Yang, W. S. & Stockwell, B. R. Ferroptosis: death by lipid peroxidation. Trends Cell Biol.26, 165–176 (2016). - PMC - PubMed
    1. Conrad, M. & Pratt, D. A. The chemical basis of ferroptosis. Nat. Chem. Biol.15, 1137–1147 (2019). - PubMed
    1. Yang, W. S. et al. Regulation of ferroptotic cancer cell death by GPX4. Cell156, 317–331 (2014). - PMC - PubMed
    1. Doll, S. et al. FSP1 is a glutathione-independent ferroptosis suppressor. Nature575, 693–698 (2019). - PubMed

LinkOut - more resources