

The influence of land surface temperature on Ghana's climate variability and implications for sustainable development
- PMID: 39833286
- PMCID: PMC11746929
- DOI: 10.1038/s41598-025-86585-9
The influence of land surface temperature on Ghana's climate variability and implications for sustainable development
Abstract
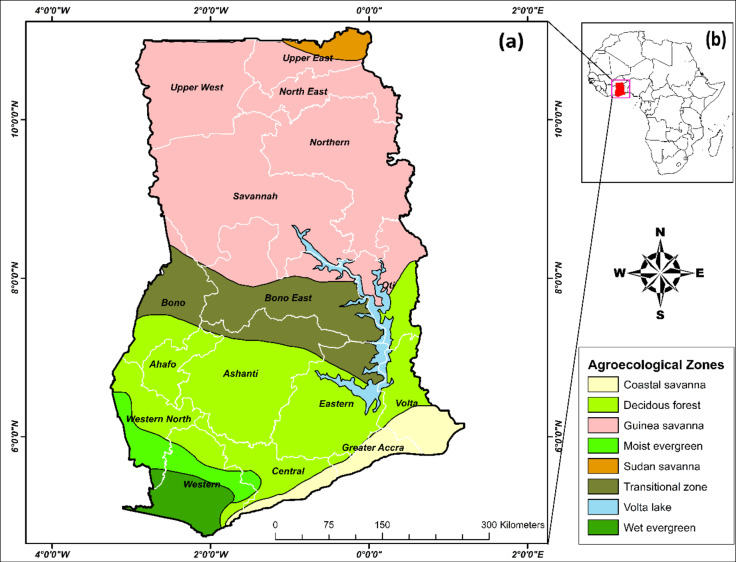
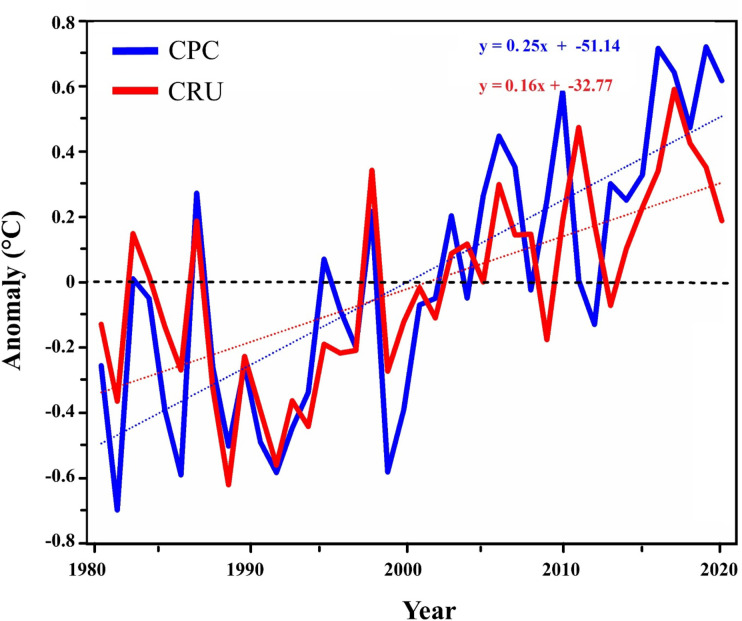
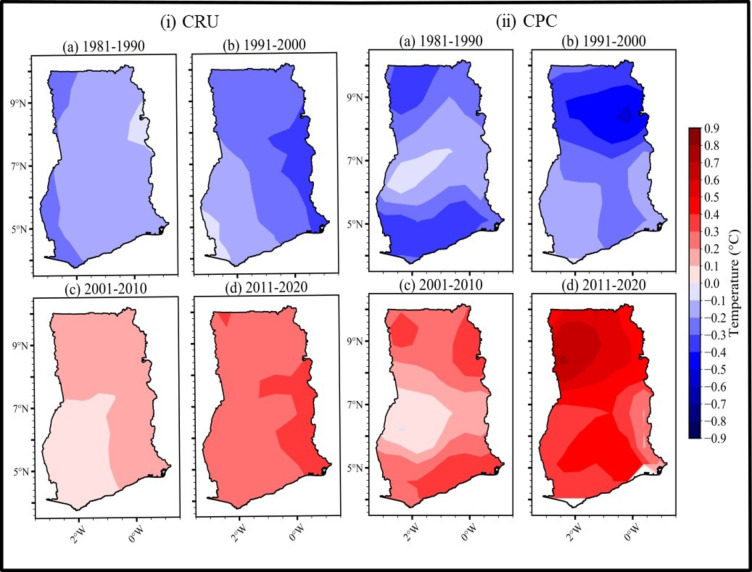
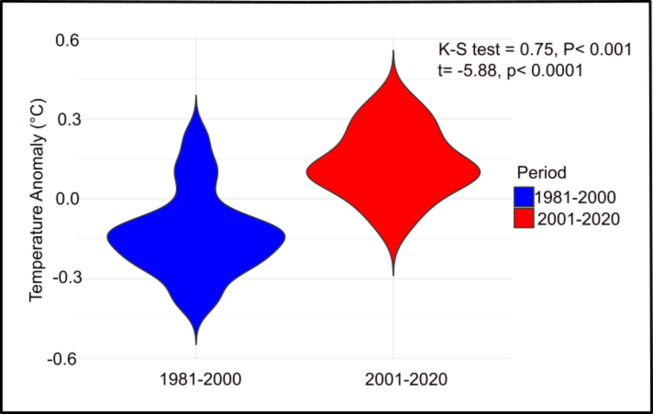
Climate change poses significant global challenges, especially in the West African sub-region, with high temperature and precipitation patterns variability, threatening socio-economic stability and ecosystem health. While global factors such as greenhouse gases and oceanic circulations shape regional climates, this study focuses on the understudied role of local climatic variables in influencing near-surface air temperature (NST) in Ghana from 1981 to 2020. Based on ground observations, our findings reveal significant correlations between land surface temperature (LST) and NST before and after the identified breakpoint year of 2001. Additionally, we observe a reduction in precipitation post-2001. We also identify LST as the primary driver of NST and precipitation changes based on cause-effect analysis of multiple factors. Specifically, higher LST leads to decreased precipitation and increased NST, contributing to the increasing trend of NST over the last two decades. The insights are vital for developing targeted adaptation strategies, including integrated land and water management, sustainable agriculture, and effective interventions, directly supporting the United Nations Sustainable Development Goals (SDG) 13 (Climate Action) and SDG 15 (Life on Land). Moreover, the study provides evidence for promoting climate-smart agriculture to ensure food security (SDG 2). By integrating these findings into climate adaptation frameworks, policymakers and stakeholders can better address the unique challenges posed by climate variability in Ghana, ensuring more resilient and sustainable environmental management.
Keywords: climate change adaptation; land surface temperature; multivariate causality analysis; near–surface temperature; precipitation; sustainable development goals.
© 2025. The Author(s).
Conflict of interest statement
Declarations. Competing interests: The authors declare no competing interests.
Figures


Similar articles
-
The 2023 Latin America report of the Lancet Countdown on health and climate change: the imperative for health-centred climate-resilient development.Lancet Reg Health Am. 2024 Apr 23;33:100746. doi: 10.1016/j.lana.2024.100746. eCollection 2024 May. Lancet Reg Health Am. 2024. PMID: 38800647 Free PMC article. Review.
-
The Minderoo-Monaco Commission on Plastics and Human Health.Ann Glob Health. 2023 Mar 21;89(1):23. doi: 10.5334/aogh.4056. eCollection 2023. Ann Glob Health. 2023. PMID: 36969097 Free PMC article. Review.
-
Multi-impacts of climate change and mitigation strategies in Nigeria: agricultural production and food security.Sci One Health. 2025 May 16;4:100113. doi: 10.1016/j.soh.2025.100113. eCollection 2025. Sci One Health. 2025. PMID: 40521404 Free PMC article. Review.
-
Land Use Change and Climate Variation in the Three Gorges Reservoir Catchment from 2000 to 2015 Based on the Google Earth Engine.Sensors (Basel). 2019 May 7;19(9):2118. doi: 10.3390/s19092118. Sensors (Basel). 2019. PMID: 31067808 Free PMC article.
-
Exploring the LULC dynamics and its relation with land surface temperature variation using split window algorithm: A study of Barasat subdivision, West Bengal, India.Environ Monit Assess. 2024 Oct 18;196(11):1070. doi: 10.1007/s10661-024-13180-2. Environ Monit Assess. 2024. PMID: 39419887
Cited by
-
TreeGrid: A Spatial Planning Tool Integrating Tree Species Traits for Biodiversity Enhancement in Urban Landscapes.Animals (Basel). 2025 Jun 22;15(13):1844. doi: 10.3390/ani15131844. Animals (Basel). 2025. PMID: 40646743 Free PMC article.
References
-
- Christy, J. R., Norris, W. B. & McNider, R. T. Surface temperature variations in east Africa and possible causes. J. Clim.22, 3342–3356 (2009).
-
- Lockwood, M. Solar influence on global and regional climates. Surv. Geophys.33, 503–534 (2012).
-
- Peng, J., Loew, A. & Crueger, T. The relationship between the Madden-Julian oscillation and the land surface soil moisture. Remote Sens. Environ.203, 226–239 (2017).
-
- Iyakaremye, V. et al. Increased high-temperature extremes and associated population exposure in Africa by the mid-21st century. Sci. Total Environ.790, (2021). - PubMed
-
- Sun, W. et al. The assessment of global surface temperature change from 1850s: the C-LSAT2.0 ensemble and the CMST-Interim datasets. Adv. Atmos. Sci.38, 875–888 (2021).
Grants and funding
LinkOut - more resources
Full Text Sources
