. 2025 Feb;28(2):248-258.
doi: 10.1038/s41593-024-01834-w. Epub 2025 Jan 20.

Mapping the cellular etiology of schizophrenia and complex brain phenotypes

Affiliations

Mapping the cellular etiology of schizophrenia and complex brain phenotypes

Laramie E Duncan et al. Nat Neurosci. 2025 Feb.

Abstract

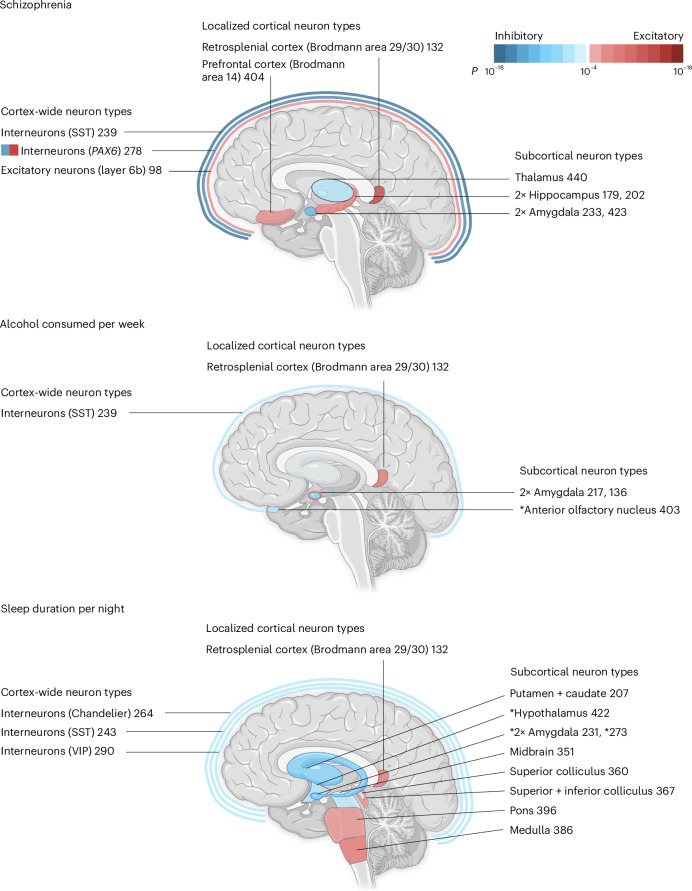
Psychiatric disorders are multifactorial and effective treatments are lacking. Probable contributing factors to the challenges in therapeutic development include the complexity of the human brain and the high polygenicity of psychiatric disorders. Combining well-powered genome-wide and brain-wide genetics and transcriptomics analyses can deepen our understanding of the etiology of psychiatric disorders. Here, we leverage two landmark resources to infer the cell types involved in the etiology of schizophrenia, other psychiatric disorders and informative comparison of brain phenotypes. We found both cortical and subcortical neuronal associations for schizophrenia, bipolar disorder and depression. These cell types included somatostatin interneurons, excitatory neurons from the retrosplenial cortex and eccentric medium spiny-like neurons from the amygdala. In contrast we found T cell and B cell associations with multiple sclerosis and microglial associations with Alzheimer's disease. We provide a framework for a cell-type-based classification system that can lead to drug repurposing or development opportunities and personalized treatments. This work formalizes a data-driven, cellular and molecular model of complex brain disorders.


Conflict of interest statement

Competing interests: K.D. is a founder and scientific advisor for Maplight Therapeutics and Stellaromics, and a scientific advisor to RedTree LLC and Modulight.

Figures

Fig. 1
Fig. 1. Approach for systematically testing 461 human brain cell types for association with schizophrenia (and other phenotypes tested).
We tested whether genes associated with schizophrenia were preferentially expressed in one or more brain cell types using linear regression and Bonferroni correction for 461 tests. a, We used two types of human genome-wide data. Left, Results from the most recent schizophrenia GWAS (n = 320,404 participants). The GWAS results are depicted using a Manhattan plot with the chromosomal position on the x axis and statistical significance (−log10(P)) on the y axis for each genetic variant tested. Right, Cell type data from the most comprehensive human brain snRNA-seq study to date (3,369,219 cells from 105 brain regions, clustered into 461 statistical clusters, referred to as cell types; see Fig. 2 for the color coding). b, Each of the 461 cell types was tested for association with schizophrenia using linear regression. As detailed in the Methods, we first calculated ‘specificity’ scores to quantify the fraction of each gene’s total expression found in each cell type. Specificity values ranged from 0 to 1; for each gene the specificity scores summed to 1 over the 461 cell types (by definition). MAGMA was first used to quantify the schizophrenia associations for each gene. Next, for each of the 461 cell types (analyzed separately), we used linear regression (implemented in MAGMA) to test for linear relationships between specificity scores and the schizophrenia associations of those genes, while correcting for known potential confounding variables. c, Results are depicted first as a cell type profile (for schizophrenia); then, associated cell types are described with functionally relevant details (for example, brain structure and inferred neurotransmitter use, receptor expression and cortical layer localization). Karyotype in a (top left) reproduced with permission from ref. under a Creative Commons license CC BY-NC-ND 4.0 and dendrogram lines in a (right) reproduced with permission from ref. , AAAS. Brain image in a (top right) created with BioRender.com.
Fig. 2
Fig. 2. Cell type associations for schizophrenia.
a, Schizophrenia results for 461 cell types are depicted in a scatterplot, with cell type number on the x axis and statistical significance on the y axis (−log10(P)), such that higher values are more statistically significant. The horizontal gray line denotes Bonferroni correction for the 461 regression analyses (P < 0.0001). The numbers above the points are cell type numbers; the numbers within the points are supercluster numbers. Larger points denote the ten cell types that were identified as relatively independent using conditional analyses. b, The top cell type for schizophrenia (no. 239) aligned to the SST interneuron subtype SST.ix (from ref. ) for which cortical layer localization was determined using spatial transcriptomics. Thus, we inferred that cell type no. 239 was probably most abundant in cortical layer 5, but also found in cortical layers 6 and 2 and 3, whereas cell type no. 242 was probably most abundant in layers 2 and 3. Panel b adapted with permission from ref. , AAAS.
Fig. 3
Fig. 3. Distinct cell type profiles for five phenotypes.
Cell-type associations for five brain-related phenotypes depicted in scatterplots, with cell types depicted in order (for 461 cell types) along the x axis and with statistical significance on the y axis (reported as −log10(P), such that higher values are more significant). The horizontal white lines represent the Bonferroni correction for 461 regression analyses (that is, P < 0.0001). The first three phenotypes (schizophrenia, alcohol consumed per week and sleep duration per night) yielded neuronal cell type associations. The two neurological phenotypes (multiple sclerosis and Alzheimer’s disease) yielded nonneuronal cell type associations of immune and microglial cell types, respectively. See Extended Data Figs. 1–4 for larger annotated scatterplots that compare the phenotypes.
Fig. 4
Fig. 4. Brain locales of origin for the relatively independent significant cell types associated with schizophrenia, alcohol consumed per week and sleep duration per night.
Inhibitory cell types are depicted in blue, excitatory cell types are depicted in red, with color saturation denoting statistical significance from the regression analyses. Unless an asterisk is present, the regions depicted were the source of more than 50% (and usually much more than 50%) of cells for a particular cell type. If there are more than one excitatory or inhibitory cell types for a single brain structure, color saturation corresponds to the more significant cell type. If both excitatory and inhibitory cell types are associated with a single structure, then the fill of the structure (as opposed to the border) denotes the more significant association. For example, there are two amygdala cell types associated with alcohol per week and the inhibitory cell type no. 217 is more significant (hence the blue/inhibitory fill). Cell type no. 278 is annotated as GABA/VGLUT3. VIP, vasoactive intestinal peptide. Figure created with BioRender.com.
Fig. 5
Fig. 5. Required statistical power of a GWAS for detecting cell type associations.
a, Number of cells in each cell type. b, Results for four successive, increasingly large and better powered schizophrenia GWAS. The horizontal lines in all plots denote the Bonferroni-corrected statistical significance for 461 regression analyses (P < 0.0001). c, In this range of sample sizes for schizophrenia GWAS, the number of loci detected continued to increase steeply, but the number of cell types plateaued. Effective n accounts for the decrease in statistical power attributable to imbalanced case control ratios: neff = 4/((1/cases) + (1/controls)). IQR, interquartile range.
Fig. 6
Fig. 6. A cellular taxonomy of brain phenotypes maps shared and non-shared cellular associations in a mechanistically informative manner.
The 31 superclusters are color-coded as in Fig. 2. a, Relatively independent significant cell types are depicted for the five primary phenotypes plus bipolar disorder and depression. Shared or ‘pleiotropic’ cell types include cortical interneurons (no. 239) and excitatory retrosplenial cortex neurons (no. 132). Regarding non-shared cell types, sleep-specific associations of pons (no. 396) and medulla (no. 386) splatter neurons are notable. b, Experimental follow-up may include testing of drugs as predicted by gene expression in associated neuron types. 1Selected receptor genes among the 200 genes with highest specificity values, for a given cell type. 2Selected neuropeptide autoannotation results from ref. .
Extended Data Fig. 1
Extended Data Fig. 1. Alcoholic drinks consumed per week cell type associations using Saunders et al. GWAS.
Cell-type associations are depicted in scatterplots, with cell types depicted in order (for 461 cell types) along the x-axis and with statistical significance on the y-axis (reported as -log10(p), such that higher values are more significant). Horizontal gray lines reflect Bonferroni correction for 461 regression analyses (that is p < 0.0001).
Extended Data Fig. 2
Extended Data Fig. 2. Sleep duration per night cell type associations using Dashti et al. GWAS.
Cell-type associations are depicted in scatterplots, with cell types depicted in order (for 461 cell types) along the x-axis and with statistical significance on the y-axis (reported as -log10(p), such that higher values are more significant). Horizontal gray lines reflect Bonferroni correction for 461 regression analyses (that is p < 0.0001). Note that the locations of splatter neuron cell types are listed in ascending order: #360, #367, #386, #396, #422; corresponding to superior colliculus, superior + inferior colliculus (SC + IC), pons, medulla, and hypothalamus.
Extended Data Fig. 3
Extended Data Fig. 3. Multiple sclerosis cell type associations using International Multiple Sclerosis Genetics Consortium GWAS.
Cell-type associations are depicted in scatterplots, with cell types depicted in order (for 461 cell types) along the x-axis and with statistical significance on the y-axis (reported as -log10(p), such that higher values are more significant). Horizontal gray lines reflect Bonferroni correction for 461 regression analyses (that is p < 0.0001).
Extended Data Fig. 4
Extended Data Fig. 4. Alzheimer’s disease cell type associations using Bellenguez et al. GWAS.
Cell-type associations are depicted in scatterplots, with cell types depicted in order (for 461 cell types) along the x-axis and with statistical significance on the y-axis (reported as -log10(p), such that higher values are more significant). Horizontal gray lines reflect Bonferroni correction for 461 regression analyses (that is p < 0.0001).
Extended Data Fig. 5
Extended Data Fig. 5. Assessment of the effect of number of cells, in each cell type, on the significance of schizophrenia associations.
A. There is no systematic relationship between the significance of the schizophrenia association for each cell type (y-axis) with the number of cells in the cell type (x-axis); r = .06, p = .18; from Pearson correlation. B. Down-sampling of cells within cell types to a maximum of 3,400, 340, and 34 cells decreased power to detect schizophrenia associations. However, most of the schizophrenia associations detected with no down-sampling (top plot) were detected in all of the down-sampled analyses, even with only 34 cells per cell type (bottom plot).
Extended Data Fig. 6
Extended Data Fig. 6. Significant drug-cell type associations, from in silico analyses, for the ten relatively independent significant cell types for schizophrenia.
Only significant (after FDR-adjustment) results are shown, with a maximum of 20 results per cell type. This figure shows how different schizophrenia-associated cell types might be differentially affected by medications. Of note, only two of the 10 cell types (#233 and #98) had antipsychotic medications among the significant drug results. Antidepressants were among the significant drug results for three cell types (#233, #98, and #202). Ketamine was the second most significant drug association for one cell type (#233) after an antipsychotic medication (chlorprothixene). Hormones were among the significant results for three cell types including the most significant cell type for schizophrenia (#239, hypothalamic hormones). Four cell types had no significant associations with specific drugs (#132, #404, #440, and #179). CNS=central nervous system, NS=nervous system. Figure created with BioRender.com.
Extended Data Fig. 7
Extended Data Fig. 7. Bipolar disorder cell type associations using Mullins et al. bipolar disorder GWAS.
Cell-type associations are depicted in scatterplots, with cell types depicted in order (for 461 cell types) along the x-axis and with statistical significance on the y-axis (reported as -log10(p), such that higher values are more significant). Horizontal gray lines reflect Bonferroni correction for 461 regression analyses (that is p < 0.0001).
Extended Data Fig. 8
Extended Data Fig. 8. Depression cell type results using Howard et al. GWAS.
Cell-type associations are depicted in scatterplots, with cell types depicted in order (for 461 cell types) along the x-axis and with statistical significance on the y-axis (reported as -log10(p), such that higher values are more significant). Horizontal gray lines reflect Bonferroni correction for 461 regression analyses (that is p < 0.0001).
Extended Data Fig. 9
Extended Data Fig. 9. Pair-wise comparison of cell type results for schizophrenia, bipolar disorder, and depression.
Axes represent -log10(p-value). The upper right quadrants of each plot depict the cell types that are significant for both disorders. Effect size estimates for each of the 461 cell types and standard deviations are available in corresponding Supplementary Tables.
Extended Data Fig. 10
Extended Data Fig. 10. Information about the number of dissections contributing to each of the 461 cell types.
For example, interneurons (cell types #236-296), shown in blue shades, are among the cell types that were found in the largest number of dissections (top). For these interneurons, no single dissection accounted for >25% of any cell type, and for most the top contributing dissection accounted for <10% of the cells in that cell type (bottom). The number of contributing dissections for these widely-distributed interneuron cell types was 56-84 (out of the 105 possible dissections performed across human brain), as described in Siletti et al..

Comment in

References

    1. 2021 National Survey on Drug Use and Health (Substance Abuse and Mental Health Services Administration, 2021); https://www.samhsa.gov/data/report/2021-nsduh-annual-national-report - PubMed
    1. Kadakia, A. et al. The economic burden of schizophrenia in the United States. J. Clin. Psychiatry83, 22m14458 (2022). - PubMed
    1. Tandon, R., Keshavan, M. S. & Nasrallah, H. A. Schizophrenia, “just the facts” what we know in 2008. 2. Epidemiology and etiology. Schizophr. Res.102, 1–18 (2008). - PubMed
    1. Hilker, R. et al. Heritability of schizophrenia and schizophrenia spectrum based on the nationwide Danish Twin Register. Biol. Psychiatry83, 492–498 (2018). - PubMed
    1. Cardno, A. G. et al. Heritability estimates for psychotic disorders: the Maudsley twin psychosis series. Arch. Gen. Psychiatry56, 162–168 (1999). - PubMed

MeSH terms

LinkOut - more resources