

Visual impairment prevention by early detection of diabetic retinopathy based on stacked auto-encoder
- PMID: 39833312
- PMCID: PMC11747016
- DOI: 10.1038/s41598-025-85752-2
Visual impairment prevention by early detection of diabetic retinopathy based on stacked auto-encoder
Erratum in
-
Correction: Visual impairment prevention by early detection of diabetic retinopathy based on stacked auto-encoder.Sci Rep. 2025 May 13;15(1):16609. doi: 10.1038/s41598-025-00655-6. Sci Rep. 2025. PMID: 40360548 Free PMC article. No abstract available.
Abstract
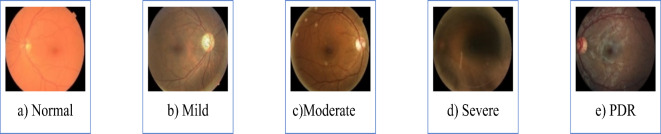
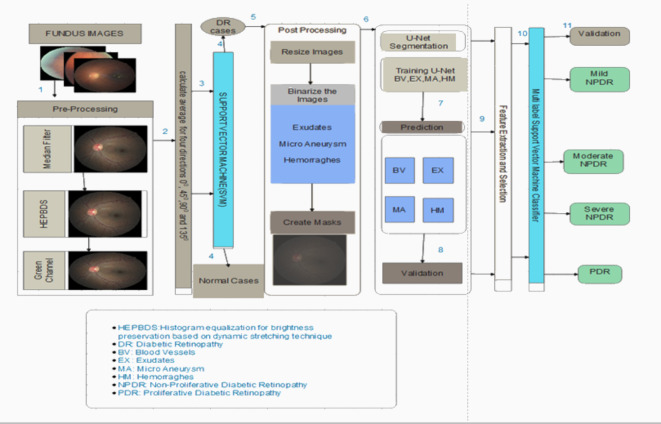
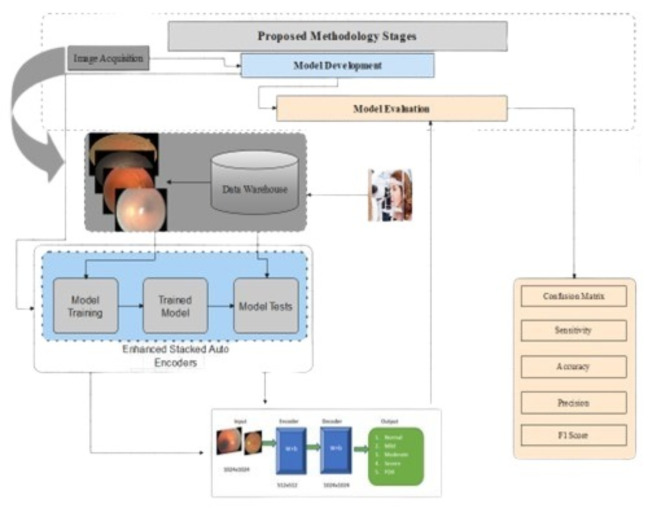
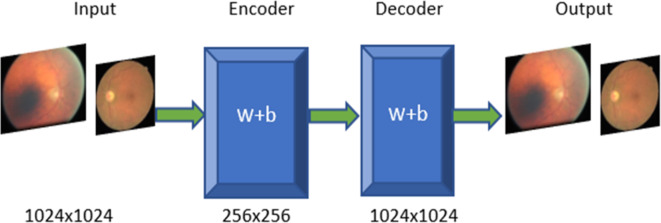
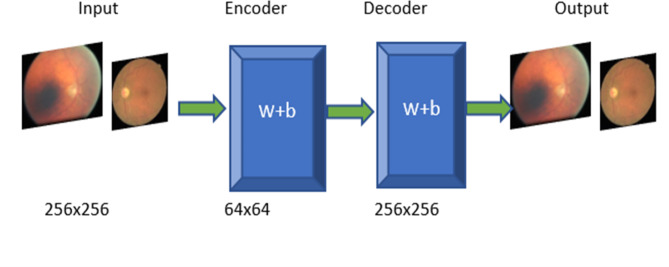
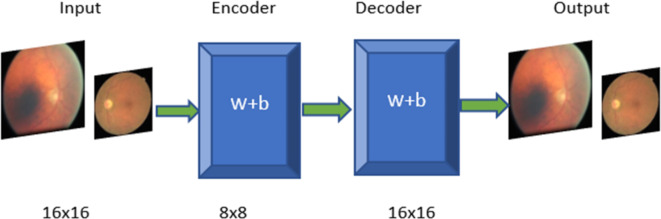
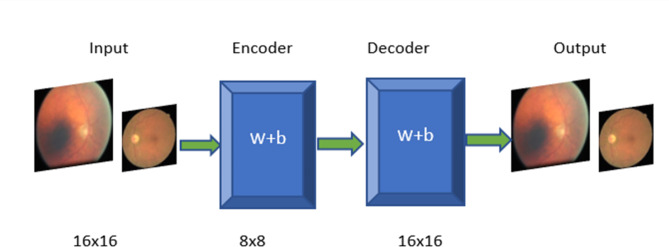
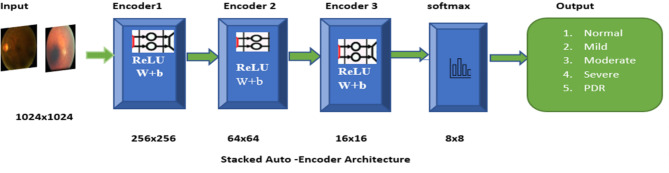
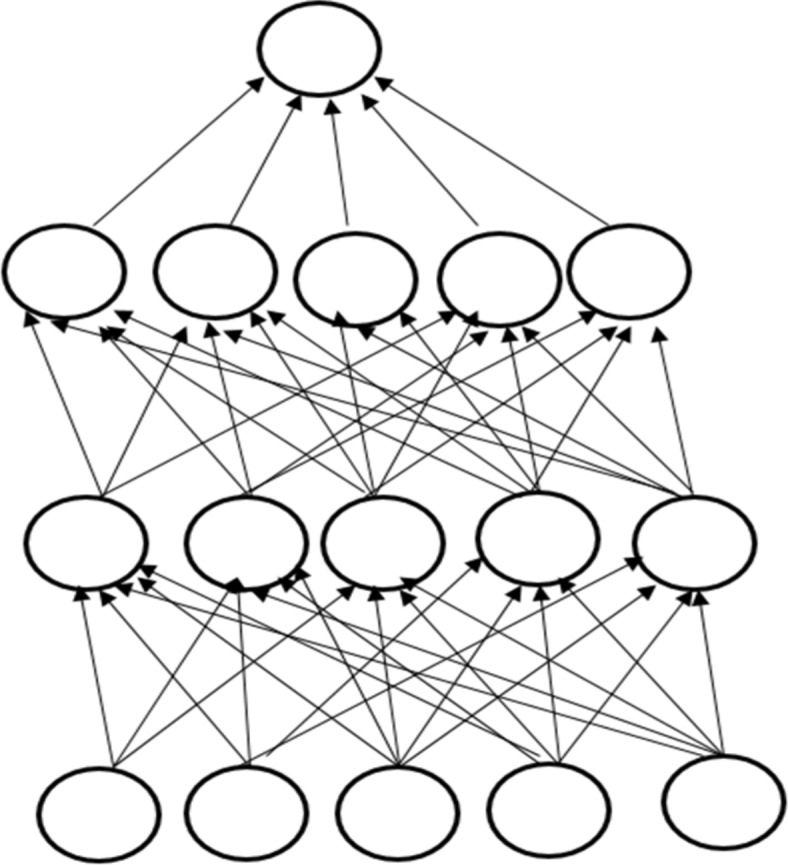
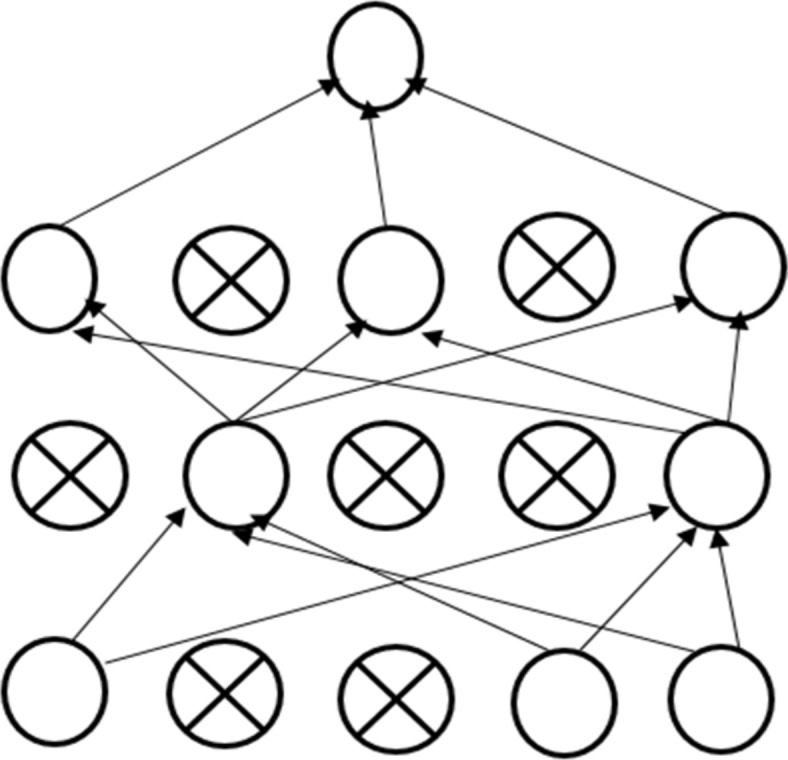
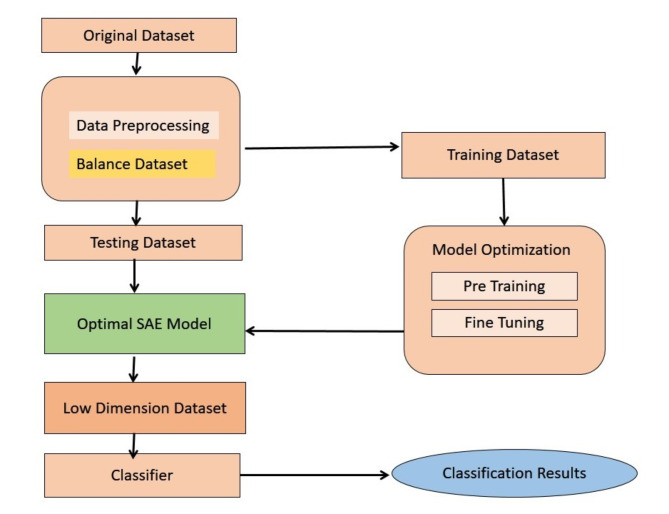
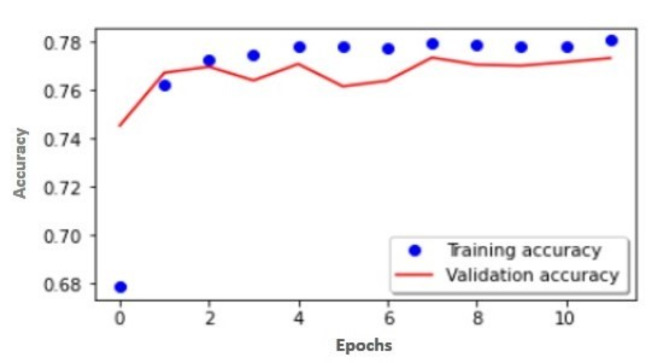
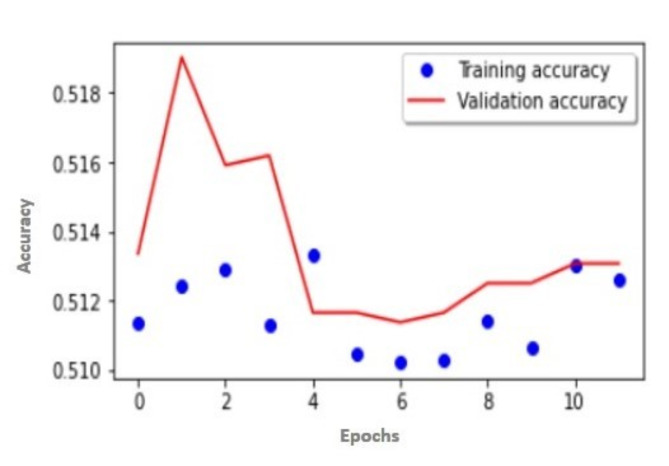
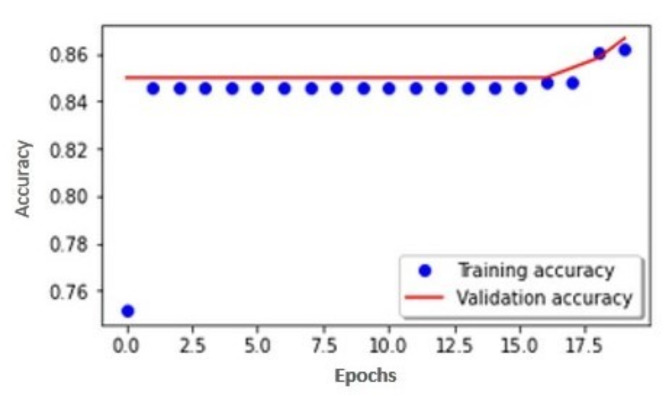
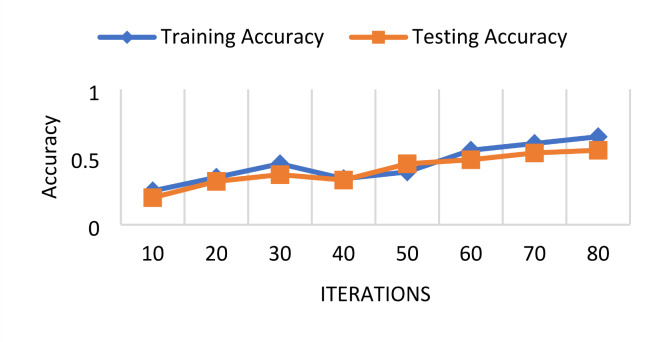
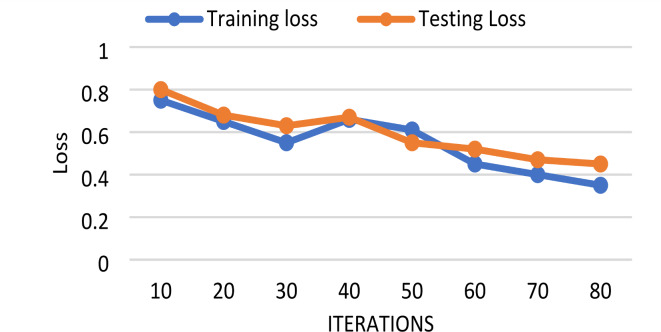
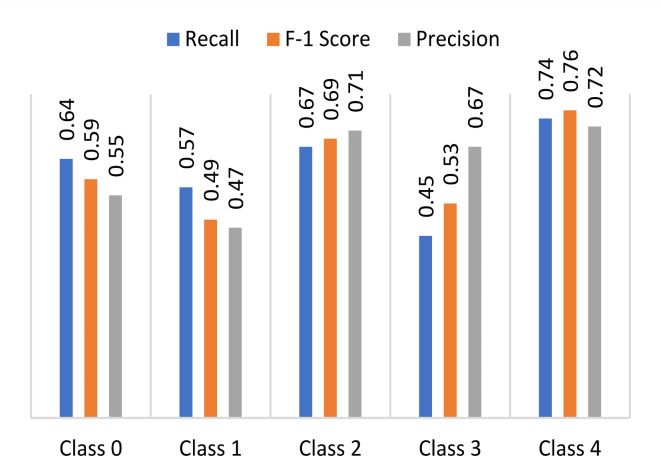
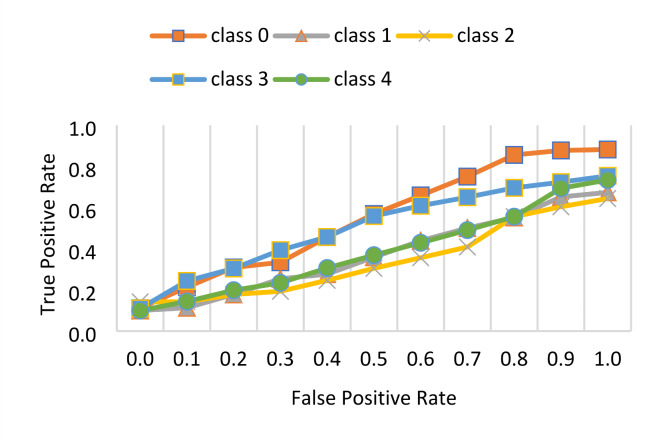
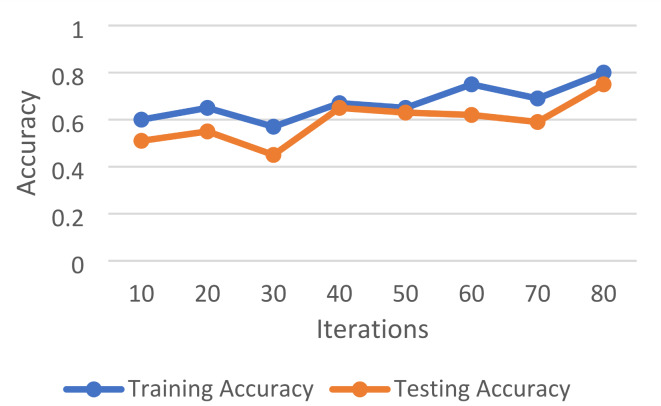
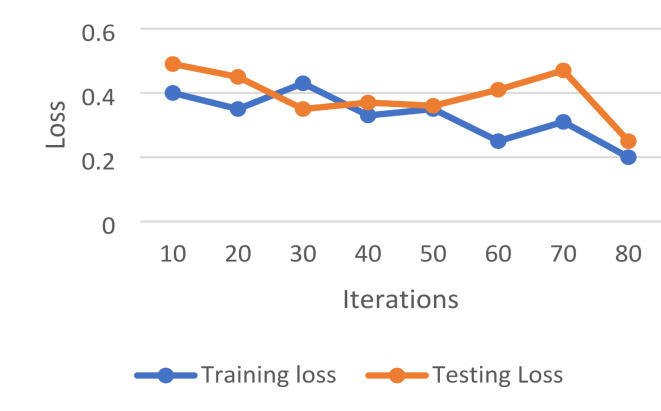
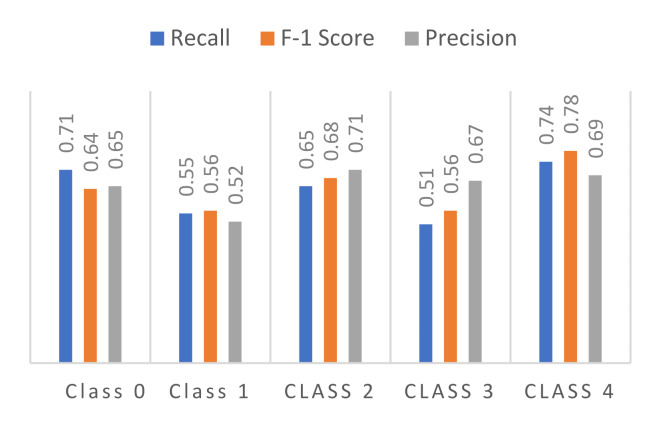
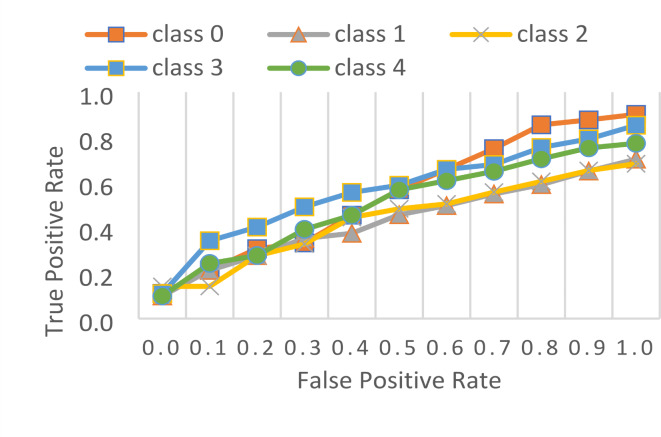
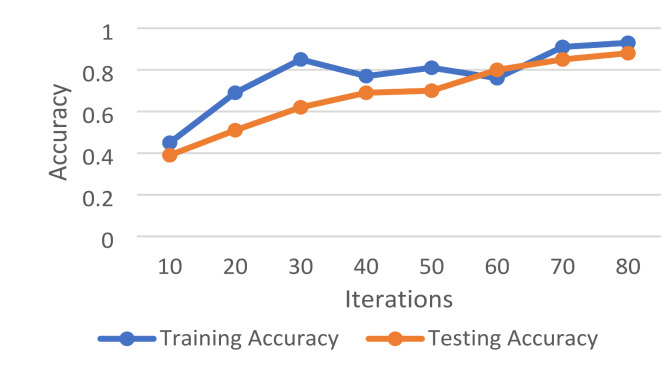
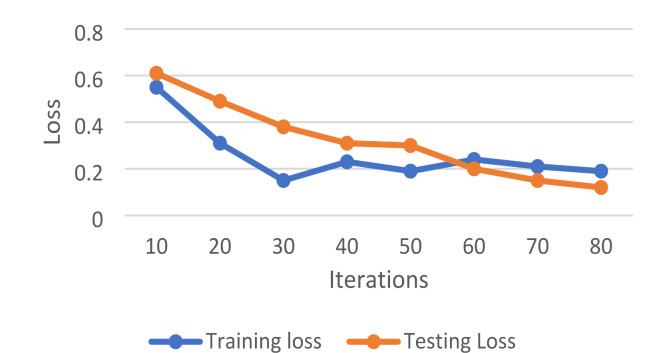
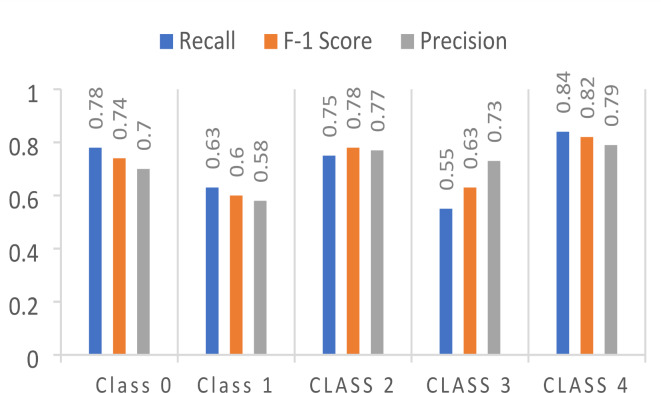
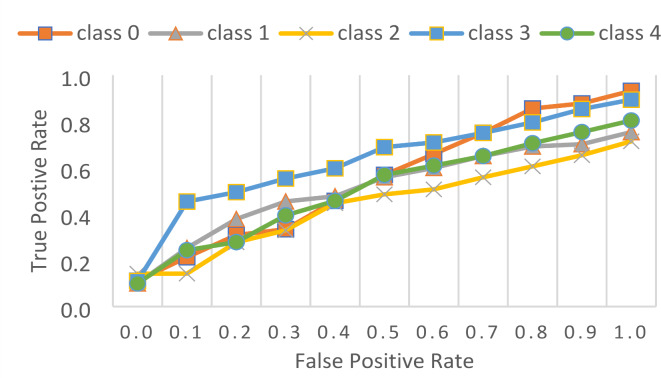
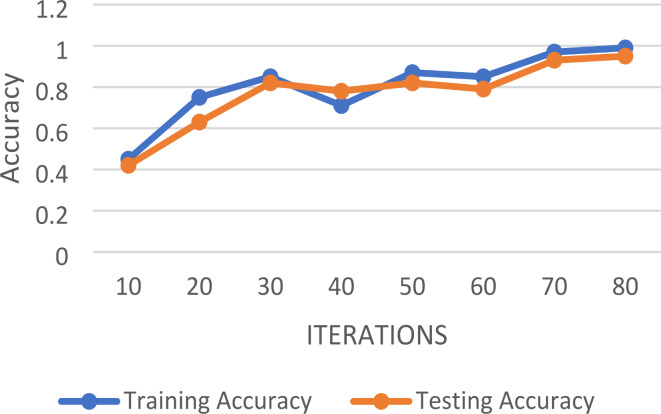
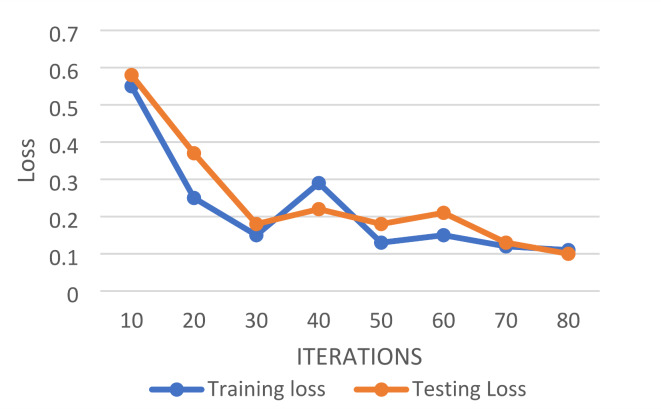
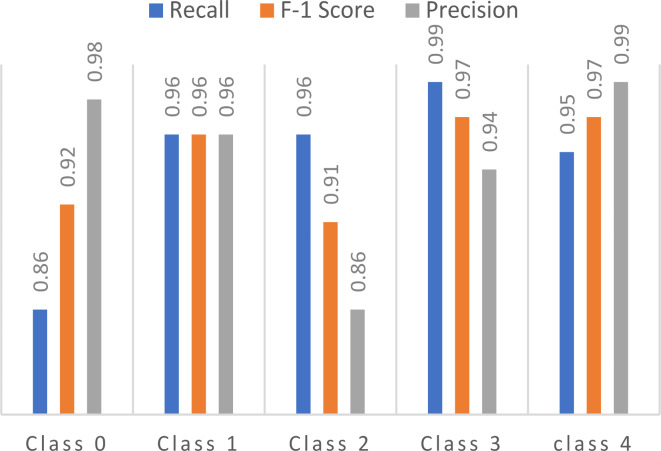
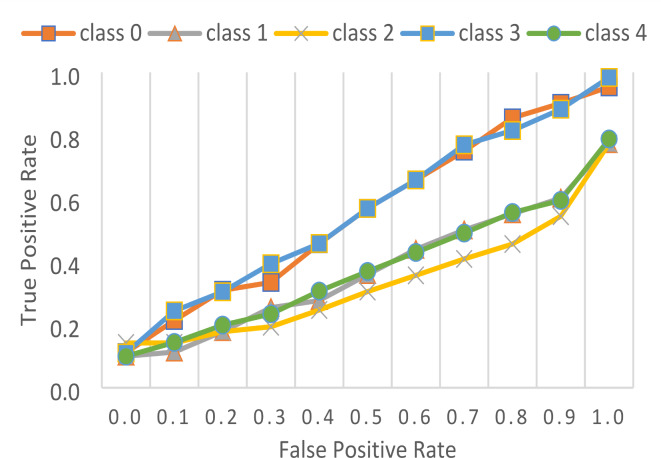
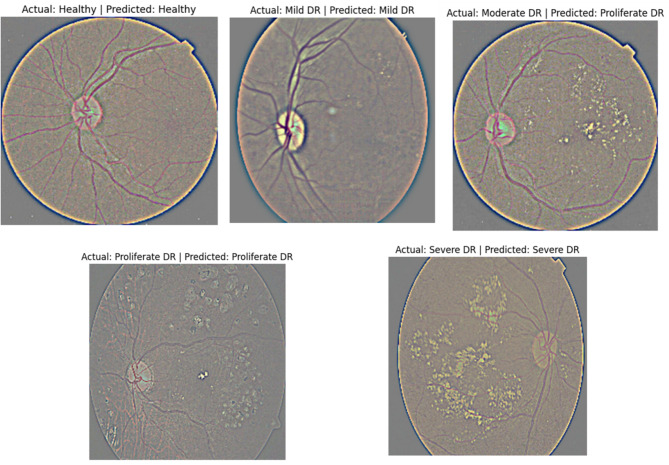
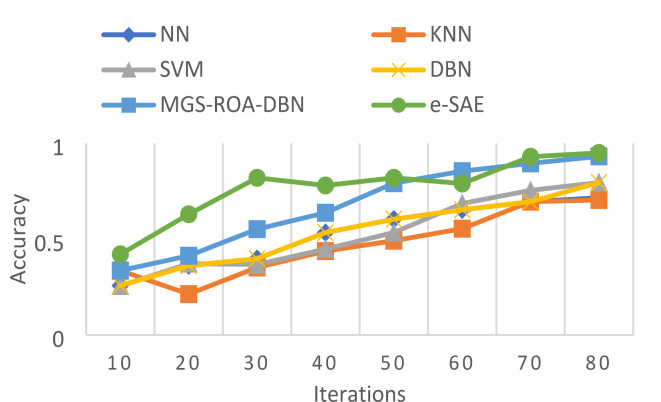
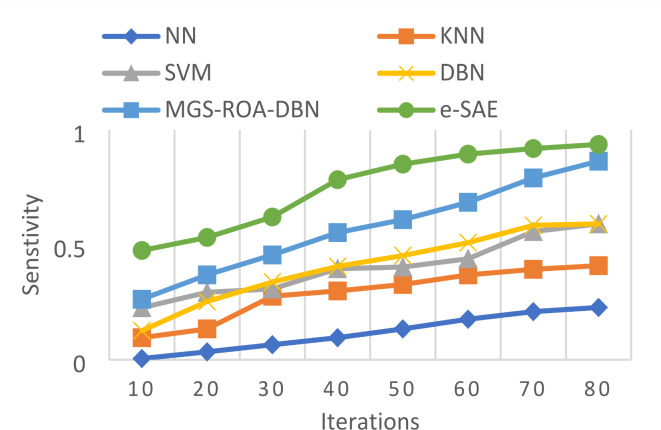
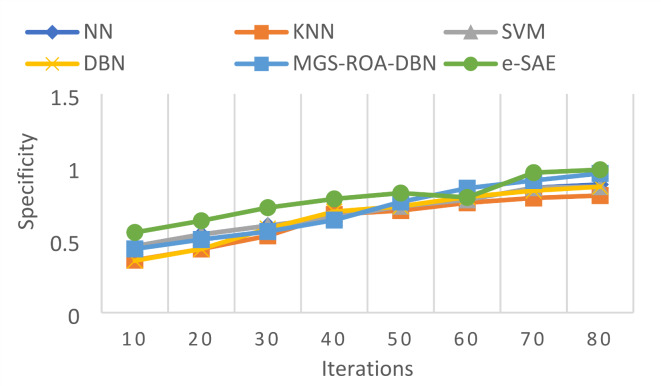
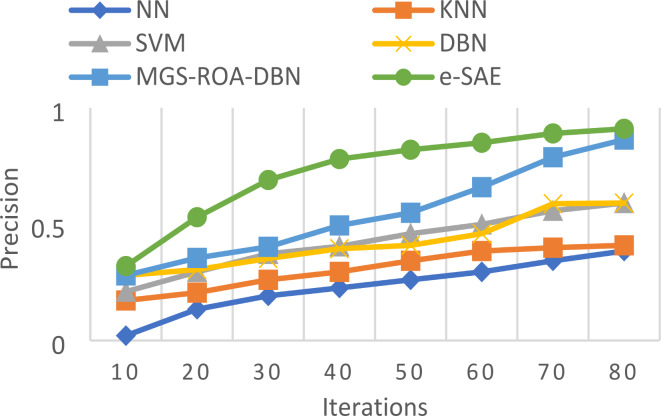
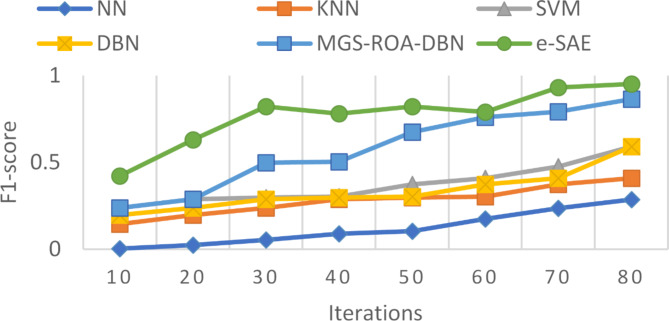
Diabetic retinopathy (DR) presents a significant concern among diabetic patients, often leading to vision impairment or blindness if left untreated. Traditional diagnosis methods are prone to human error, necessitating accurate alternatives. While various computer-aided systems have been developed to assist in DR detection, there remains a need for accurate and efficient methods to classify its stages. In this study, we propose a novel approach utilizing enhanced stacked auto-encoders for the detection and classification of DR stages. The classification is performed across one healthy (normal) stage and four DR stages: mild, moderate, severe, and proliferative. Unlike traditional CNN approaches, our method offers improved reliability by reducing time complexity, minimizing errors, and enhancing noise reduction. Leveraging a comprehensive dataset from KAGGLE containing 35,126 retinal fundus images representing one healthy (normal) stage and four DR stages, our proposed model demonstrates superior accuracy compared to existing deep learning algorithms. Data augmentation techniques address class imbalance, while SAEs facilitate accurate classification through layer-wise unsupervised pre-training and supervised fine-tuning. We evaluate our model's performance using rigorous quantitative measures, including accuracy, recall, precision, and F1-score, highlighting its effectiveness in early disease diagnosis and prevention of blindness. Experimental results across different training/testing ratios (50:50, 60:40, 70:30, and 75:25) showcase the model's robustness. The highest accuracy achieved during training was 93%, while testing accuracy reached 88% on a training/testing ratio of 75:25. Comparative analysis underscores the model's superiority over existing methods, positioning it as a promising tool for early-stage DR detection and blindness prevention.
Keywords: Deep learning; Diabetic retinopathy; Disability; Dropout; Stacked auto-encoder.
© 2025. The Author(s).
Conflict of interest statement
Declarations. Competing interests: The authors declare no competing interests.
Figures
Similar articles
-
ResViT FusionNet Model: An explainable AI-driven approach for automated grading of diabetic retinopathy in retinal images.Comput Biol Med. 2025 Mar;186:109656. doi: 10.1016/j.compbiomed.2025.109656. Epub 2025 Jan 16. Comput Biol Med. 2025. PMID: 39823821
-
Ensemble deep learning and EfficientNet for accurate diagnosis of diabetic retinopathy.Sci Rep. 2024 Dec 18;14(1):30554. doi: 10.1038/s41598-024-81132-4. Sci Rep. 2024. PMID: 39695310 Free PMC article.
-
Applying supervised contrastive learning for the detection of diabetic retinopathy and its severity levels from fundus images.Comput Biol Med. 2022 Jul;146:105602. doi: 10.1016/j.compbiomed.2022.105602. Epub 2022 May 10. Comput Biol Med. 2022. PMID: 35569335
-
Diabetic retinopathy screening through artificial intelligence algorithms: A systematic review.Surv Ophthalmol. 2024 Sep-Oct;69(5):707-721. doi: 10.1016/j.survophthal.2024.05.008. Epub 2024 Jun 15. Surv Ophthalmol. 2024. PMID: 38885761
-
Comparison review of image classification techniques for early diagnosis of diabetic retinopathy.Biomed Phys Eng Express. 2024 Sep 5;10(6). doi: 10.1088/2057-1976/ad7267. Biomed Phys Eng Express. 2024. PMID: 39173657 Review.
Cited by
-
A hybrid deep learning framework for early detection of diabetic retinopathy using retinal fundus images.Sci Rep. 2025 Apr 30;15(1):15166. doi: 10.1038/s41598-025-99309-w. Sci Rep. 2025. PMID: 40307328 Free PMC article.
References
-
- Shankar, K. et al. Automated detection and classification of fundus diabetic retinopathy images using synergic deep learning model. Pattern Recogn. Lett.133, 210–216 (2020).
-
- Dutta, S., Manideep, B., Basha, S. M., Caytiles, R. D. & Iyengar, N. Classification of diabetic retinopathy images by using deep learning models. Int. J. Grid Distrib. Comput.11, 89–106 (2018).
-
- Qiao, L., Zhu, Y. & Zhou, H. Diabetic retinopathy detection using prognosis of microaneurysm and early diagnosis system for non-proliferative diabetic retinopathy based on deep learning algorithms. IEEE Access8, 104292–104302 (2020).
-
- Jagan Mohan, N., Murugan, R., Goel, T., Mirjalili, S. & Roy, P. A novel four-step feature selection technique for diabetic retinopathy grading. Phys. Eng. Sci. Medicine44, 1351–1366 (2021). - PubMed
-
- Yun, W. L. et al. Identification of different stages of diabetic retinopathy using retinal optical images. Inf. Sci.178, 106–121 (2008).
Publication types
MeSH terms
Grants and funding
LinkOut - more resources
Full Text Sources
Medical
