Comparative Study
. 2025 Jan 20;15(1):2538.
doi: 10.1038/s41598-025-86456-3.

Machine learning validation of the AVAS classification compared to ultrasound mapping in a multicentre study

Collaborators, Affiliations
Comparative Study

Machine learning validation of the AVAS classification compared to ultrasound mapping in a multicentre study

Katerina Lawrie et al. Sci Rep. .

Abstract

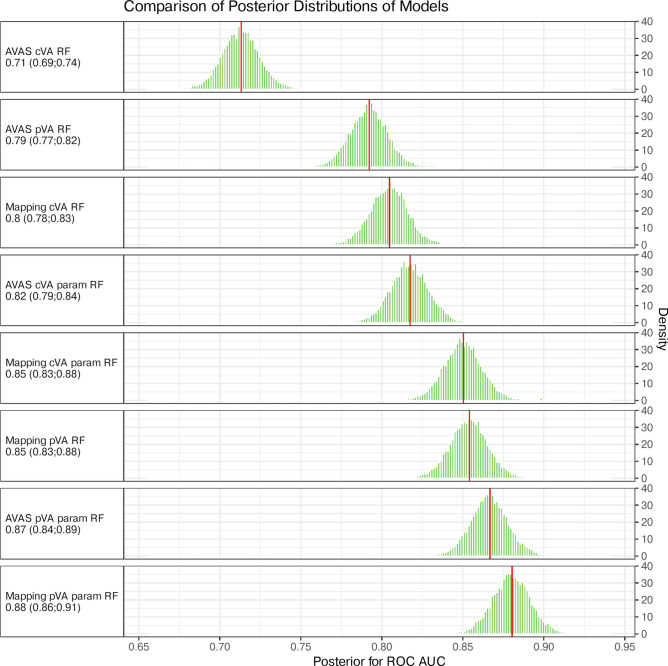
The Arteriovenous Access Stage (AVAS) classification simplifies information about suitability of vessels for vascular access (VA). It's been previously validated in a clinical study. Here, AVAS performance was tested against multiple ultrasound mapping measurements using machine learning. A prospective multicentre international study (NCT04796558) with patient recruitment from March 2021-July 2024. Demographics, risk factors, vessels parameters, types of predicted and created VA (pVA, cVA) were collected. We modelled pVA and cVA using the Random Forest algorithm. Model performance was estimated and compared using Bayesian generalized linear models. ROC AUC with 95% credible intervals was the performance metric. 1151 patients were included. ROC AUC for pVA prediction by AVAS was 0.79 (0.77;0.82) and by mapping was 0.85 (0.83;0.88). ROC AUC for cVA prediction by AVAS was 0.71 (0.69;0.74) and by mapping was 0.8 (0.78;0.83). Using AVAS with other parameters increased the ROC AUC to 0.87 for pVA (0.84;0.89) and 0.82 (0.79;0.84) for cVA. Using mapping with other parameters increased the ROC AUC to 0.88 for pVA (0.86;0.91) and 0.85 (0.83;0.88) for cVA. Multiple mapping measurements showed higher performance at VA prediction than AVAS. However, AVAS is simpler and quicker, so may be preferable for routine clinical practice.

Keywords: Arteriovenous access; Classification system; Dialysis; Mapping; Random forest; Renal replacement therapy.


Conflict of interest statement

Declarations. Competing interests: The authors declare no competing interests. Ethical approval: The study was approved by Ethics Committee of University Hospital Královské Vinohrady in Prague, Czech Republic (EK-VP/06/0/2021).

Figures

Fig. 1
Fig. 1
Distribution of AVAS classes, created (cVA) and predicted (pVA) vascular accesses ordered by their frequencies. Left with native categories, right with collapsed categories used in the models. Rcdi = autogenous radial-cephalic direct wrist access, autogenous radial-cephalic forearm transposition and autogenous ulnar-basilic forearm transposition, BC = autogenous brachial-cephalic forearm looped transposition, autogenous brachial-cephalic upper arm direct access and endovascular arteriovenous fistula, RCPr = autogenous radial-cephalic direct proximal access, Snuff = autogenous posterior radial branch-cephalic direct access, BB = 1st stage brachial-basilic fistula and autogenous brachial-basilic upper arm transposition, AVG = prosthetic brachial-antecubital forearm loop access and prosthetic brachial-axillary access, 3 = lower extremity access procedure, others, and none.
Fig. 2
Fig. 2
Comparison of posterior distributions of ROC AUC (density histograms) for Random Forest models, ranked by mean ROC AUC (red vertical line). The strips on the left display the model shortcuts along with the mean ROC AUC value and 95% credible interval in parentheses. Note: cVA = created vascular access as the target, pVA = predicted vascular access as the target, AVAS = AVAS class as a feature, Mapping = vascular mapping parameters as features, params = additional demographic and risk parameters as features.
Fig. 3
Fig. 3
Comparison of posterior distributions of ROC AUC (density histograms) for Random Forest models with AVAS versus mapping parameters as features. The left panels show the posterior distributions of the ROC AUC for each model, with models using AVAS classes as features shown in red and models using mapping parameters in blue. The right panels display the posterior distribution of the difference in ROC AUC between models, shown in green. The vertical dashed line at zero indicates no difference. Graphs A compare AVAS and mapping in the prediction of pVA, while Graphs B show the prediction of cVA. Graphs C and D are analogous but include demographic and risk parameters as additional features. Note: pVA = predicted vascular access as the target, cVA = created vascular access as the target, AVAS = AVAS class as a feature, Mapping = vascular mapping parameters as features, param = other demographic and risk parameters as features.
Fig. 4
Fig. 4
Permutation feature importance of demographic and risk features. Note: pVA = predicted vascular access as a target, cVA = created vascular access as a target, AVAS = AVAS class as feature, Mapping = vascular mapping parameters as features, param = other demographic and risk parameters as features, CV LINE = central venous line, DM = diabetes mellitus, IHD = ischaemic heart disease.

References

    1. Woo, K. T., Choong, H. L., Wong, K. S., Tan, H. B. & Chan, C. M. The contribution of chronic kidney disease to the global burden of major noncommunicable diseases. Kidney Int.81, 1044–1045 (2012). - PubMed
    1. Shi, B., Ying, T. & Chadban, S. J. Survival after kidney transplantation compared with ongoing dialysis for people over 70 years of age: A matched-pair analysis. Am. J. Transplant.23, 1551–1560 (2023). - PubMed
    1. Tonelli, M. et al. Systematic review: Kidney transplantation compared with dialysis in clinically relevant outcomes. Am. J. Transplant.11, 2093–2109 (2011). - PubMed
    1. Hernández, D. et al. Mortality in elderly waiting-list patients versus age-matched kidney transplant recipients: Where is the risk?. Kidney Blood Press. Res.43, 256–275. 10.1159/000487684 (2018). - PubMed
    1. Schold, J. D., Srinivas, T. R., Sehgal, A. R. & Meier-Kriesche, H. U. Half of kidney transplant candidates who are older than 60 years now placed on the waiting list will die before receiving a deceased-donor transplant. Clin. J. Am. Soc. Nephrol.4, 1239 (2009). - PMC - PubMed

Publication types

Associated data