

Gut microbiota profiles of sympatric snub-nosed monkeys and macaques in Qinghai-Tibetan Plateau show influence of phylogeny over diet
- PMID: 39833341
- PMCID: PMC11747120
- DOI: 10.1038/s42003-025-07538-6
Gut microbiota profiles of sympatric snub-nosed monkeys and macaques in Qinghai-Tibetan Plateau show influence of phylogeny over diet
Abstract
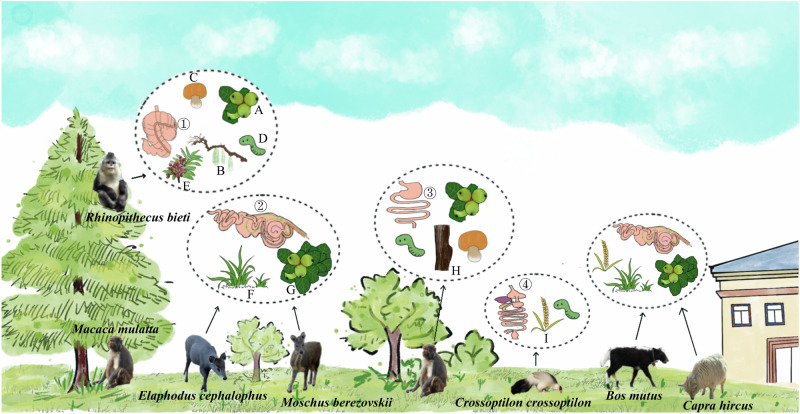
The unique environment of the Qinghai-Tibetan Plateau provides a great opportunity to study how primate intestinal microorganisms adapt to ecosystems. The 16S rRNA gene amplicon and metagenome analysis were conducted to investigate the correlation between gut microbiota in primates and other sympatric animal species living between 3600 and 4500 m asl. Results showed that within the same geographical environment, Macaca mulatta and Rhinopithecus bieti exhibited a gut microbiome composition similar to that of Tibetan people, influenced by genetic evolution of host, while significantly differing from other distantly related animals. The gut microbiota of plateau species has developed similar strategies to facilitate their hosts' adaptation to specific environments, including broadening its dietary niche and enhancing energy absorption. These findings will enhance our comprehension of the significance of primate gut microbiota in adapting to specific habitats.
© 2025. The Author(s).
Conflict of interest statement
Competing interests: The authors declare no competing interests.
Figures


Similar articles
-
Comparative study of the gut microbiota in three captive Rhinopithecus species.BMC Genomics. 2023 Jul 14;24(1):398. doi: 10.1186/s12864-023-09440-z. BMC Genomics. 2023. PMID: 37452294 Free PMC article.
-
Characterization of the Gut Microbiota in Six Geographical Populations of Chinese Rhesus Macaques (Macaca mulatta), Implying an Adaptation to High-Altitude Environment.Microb Ecol. 2018 Aug;76(2):565-577. doi: 10.1007/s00248-018-1146-8. Epub 2018 Jan 25. Microb Ecol. 2018. PMID: 29372281
-
Gut microbiome reveals the trophic variation and significant adaption of three sympatric forest-dwelling ungulates on the eastern Qinghai-Xizang Plateau.BMC Microbiol. 2025 Mar 11;25(1):128. doi: 10.1186/s12866-025-03812-z. BMC Microbiol. 2025. PMID: 40069605 Free PMC article.
-
Recent Advances in Genetics and Genomics of Snub-Nosed Monkeys (Rhinopithecus) and Their Implications for Phylogeny, Conservation, and Adaptation.Genes (Basel). 2023 Apr 27;14(5):985. doi: 10.3390/genes14050985. Genes (Basel). 2023. PMID: 37239345 Free PMC article. Review.
-
Yaks Are Dependent on Gut Microbiota for Survival in the Environment of the Qinghai Tibet Plateau.Microorganisms. 2024 May 31;12(6):1122. doi: 10.3390/microorganisms12061122. Microorganisms. 2024. PMID: 38930503 Free PMC article. Review.
Cited by
-
Intestinal microbiota profiles of captive-bred cynomolgus macaques reveal influence of biogeography and age.Anim Microbiome. 2025 May 14;7(1):47. doi: 10.1186/s42523-025-00409-9. Anim Microbiome. 2025. PMID: 40369669 Free PMC article.
-
Updating conservation metagenomics on the gut microbiome of threatened mammals.iScience. 2025 Jun 25;28(7):113000. doi: 10.1016/j.isci.2025.113000. eCollection 2025 Jul 18. iScience. 2025. PMID: 40687781 Free PMC article. Review.
References
-
- Xu, S. et al. A genome-wide search for signals of high-altitude adaptation in Tibetans. Mol. Biol. Evol.28, 1003–1011 (2011). - PubMed
-
- Xiang, Z. F., Huo, S., Xiao, W., Quan, R. C. & Grueter, C. C. Diet and feeding behavior of Rhinopithecus bieti at Xiaochangdu, Tibet: adaptations to a marginal environment. Am. J. Primatol.69, 1141–1158 (2007). - PubMed
MeSH terms
Substances
Grants and funding
LinkOut - more resources
Full Text Sources
