. 2025 May;32(5):914-925.
doi: 10.1038/s41594-024-01480-7. Epub 2025 Jan 20.

Structures of aberrant spliceosome intermediates on their way to disassembly

Affiliations

Structures of aberrant spliceosome intermediates on their way to disassembly

Komal Soni et al. Nat Struct Mol Biol. 2025 May.

Abstract

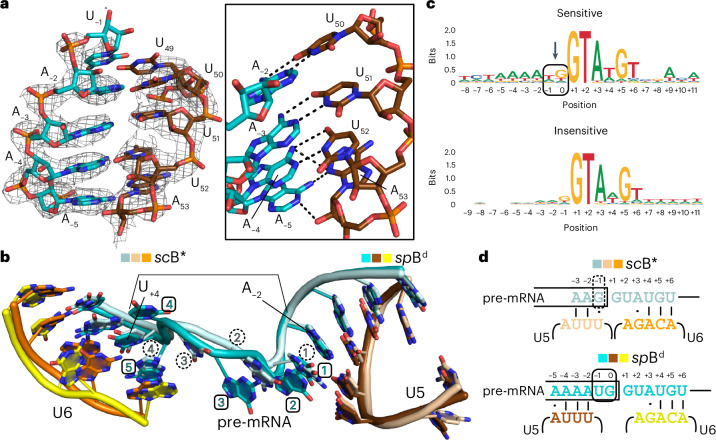
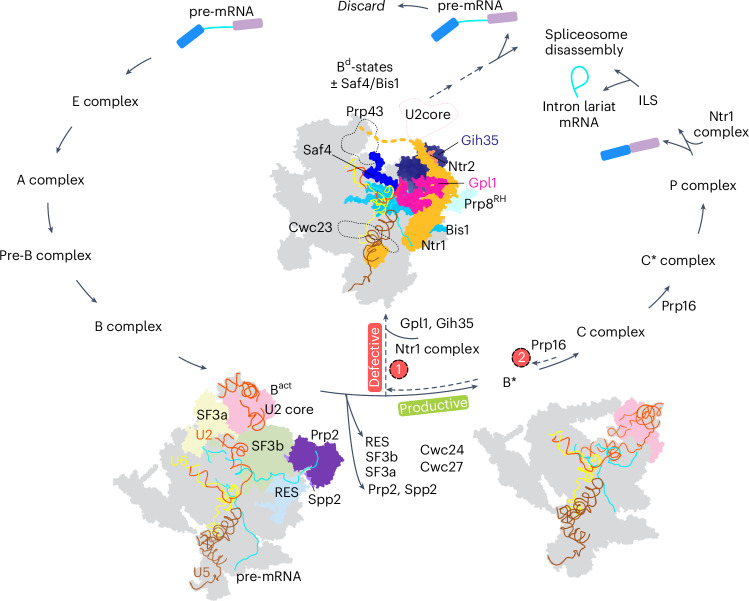
Intron removal during pre-mRNA splicing is of extraordinary complexity and its disruption causes a vast number of genetic diseases in humans. While key steps of the canonical spliceosome cycle have been revealed by combined structure-function analyses, structural information on an aberrant spliceosome committed to premature disassembly is not available. Here, we report two cryo-electron microscopy structures of post-Bact spliceosome intermediates from Schizosaccharomyces pombe primed for disassembly. We identify the DEAH-box helicase-G-patch protein pair (Gih35-Gpl1, homologous to human DHX35-GPATCH1) and show how it maintains catalytic dormancy. In both structures, Gpl1 recognizes a remodeled active site introduced by an overstabilization of the U5 loop I interaction with the 5' exon leading to a single-nucleotide insertion at the 5' splice site. Remodeling is communicated to the spliceosome surface and the Ntr1 complex that mediates disassembly is recruited. Our data pave the way for a targeted analysis of splicing quality control.


Conflict of interest statement

Competing interests: The authors declare no competing interests.

Figures

Fig. 1
Fig. 1. Cryo-EM structure of the spBd complex.
a,b, Structures of the spBd-I (a) and spBd-II (b) complexes at average resolutions of 3.2 and 3.1 Å. Two views of the spBd complexes are shown, colored according to the different subunits, which are listed below the structure. The Ntr1 protein is marked (*) and is only partially visible in the spBd-I state while stabilized in the spBd-II state. Protein components that are only part of the spBd-II state are indicated.
Fig. 2
Fig. 2. The Ntr1 complex is stabilized in the spBd-II state.
a, Schematic representation of the domain architecture of Ntr1. b, Superimposition of the Ntr1 CTD from the spBd-I and spBd-II states with their respective cryo-EM maps and the Ntr1 superhelical domain and Ntr2 (residues 296–325) with the spBd-II cryo-EM map. c, Saf4 and Bis1 are incorporated in the spBd-II state. A structure superposition of the spBd-I and spBd-II states is shown. The color scheme of spBd-II state follows Fig. 1; from the spBd-I state, only Syf2 and Cef1 are shown (dark red and orange, respectively). Insets 1 and 2 show zoomed-in views of structural differences between the two states. Cef1 residues 379–409 in the spBd-I state are displaced by Saf4 in the spBd-II state. Syf2 residues 194–215 are destabilized by the presence of Bis1 in spBd-II state. d, The superhelical domain of Ntr1 contacts Ntr2, Prp45 and Bis1 and is positioned close to Gih35 in the spBd-II state. e, Top, domain architecture of Bis1 with the helical bundle marked and other helices shown as gray boxes. Bottom, residues 22–262 (including gaps) of Bis1 that can be traced in the spBd-II state. In addition to the helical bundle, ~80 residues of Bis1 can be traced (shown in surface representation). f, The Ntr1 CTD is anchored on Snu114. In the scILS complex, this association is stabilized by an α-helix of Cwc23 (residues 122–146).
Fig. 3
Fig. 3. Interactions of Gpl1 and Gih35 with the spliceosome.
a, Cryo-EM map for the entire Gpl1 trace visible in the spBd-II complex (residues 25–188, 199–234). Zoomed-in views of representative regions of Gpl1 for spBd interaction are shown as insets. b, Gpl1 forms a bridge between Prp8 and Gih35. Regions largely adjacent to the G-patch domain contribute to the interaction. The boundaries of different regions of Gpl1 interacting with the helicase Gih35 and distinct domains of Prp8 are shown (N and C termini of the two Gpl1 fragments visible in the spBd complex are marked with black dots). c, Gpl1 binds to Prp8 and Gih35 and bridges between the two proteins. d, Gpl1–Prp8 interaction, Top, schematic representation of the domain architecture of Prp8. Bottom, Gpl1 contacts the Prp8 RT, thumb/X, linker (including the 1585-loop), En and RH domains. Residues contacting the pre-mRNA in the active site of the spliceosome are indicated. The Gpl1 knob (residues 123–137) is marked with a green star in c,d.
Fig. 4
Fig. 4. Gih35–Gpl1 is a helicase–G-patch protein pair.
a, Top, schematic representation of the domain architecture of Gih35 and Gpl1. Bottom, overview of the Gih35–Gpl1 interactions. The positions of the Gpl1 brace helix and brace loop are marked. b, Comparison of helicase–G-patch protein interactions. Superposition of the Gih35–Gpl1 complex (spBd) with that of S.cerevisiae Prp2–Spp2, two structures of the C. thermophilum Prp2–Spp2 and the human DHX15–NKRF complex. The structures are aligned on the RecA2 (left) and RecA1 (right) domains of the respective helicase, showing structural conservation in the brace helix and brace loop regions, respectively. For simplicity, only the helicases Gih35 (color-coded similar to a) and scPrp2 (gray) are shown. c, Sequence alignment of G-patch proteins from S.pombe, S.cerevisiae and H.sapiens known or predicted as coactivators of Gih35, Prp43 and Prp2 (DHX35, DHX15 or DHX16 in humans, respectively). d, The electrostatic surface potential (±5 kT; red, negative; blue, positive) of Gih35 is plotted. Conserved hydrophobic residues of the Gpl1 G-patch are marked and the Cα atoms of the conserved glycine residues are shown as spheres. The central α-helix in the brace linker is marked with an arrow. e, Y2H experiments show that Gpl1 interacts with Gih35 and Ntr1 interacts with Prp43. Full-length Gpl1 or Ntr1 constructs were fused to the Gal4 DNA-binding domain (G4BD) while full-length Gih35 and Prp43 were fused to the Gal4 activation domain (G4AD). Autoactivation controls are provided. Serial dilutions of equivalent amounts of yeast were plated on double-dropout (−Leu−Trp) and triple-dropout (−Leu−Trp−His, −Leu−Trp−Ade) media, with growth on triple-dropout media indicating an interaction between the tested proteins. f, In the spBd-II state, the Gih35 RecA2 domain (light purple) is anchored in a pocket formed by Prp8RT, Ntr1, Ntr2, NTC proteins Cef1 and Clf1 and a helix of an unknown protein (light brown). Source data
Fig. 5
Fig. 5. Noncanonical active site of the spBd complex.
a, The spBd cryo-EM map shows that a tight RNA duplex is formed between U5 loop I and 5′ exon nucleotides A−2A−3A−4A−5. Inset, zoomed-in view of interactions between U5 loop I and 5′ exon with hydrogen bonds marked as dotted lines. b, Superposition of RNA elements (pre-mRNA, U5 and U6) at the active site of spBd and canonical scB* (PDB 6J6Q) complexes. The bracket marks the positions of pre-mRNA bases A−2 and U+4, which are covered by four nucleotides in scB* (dashed circles) and five nucleotides in spBd (square boxes). c, The 5′ss sequence logo generated from CNM-sensitive (top) and CNM-insensitive (bottom) transcripts after normalization by gene expression. The insertion at the −1/0 position is marked with an arrow. d, Scheme of RNA elements at the active site of spBd using the 5′ss sequence logo from c and canonical scB* (PDB 6J6Q) complexes. The insertion at the −1/0 position is marked with a continuous box in spBd complex while the G−1 position in the scB* complex is marked with a dashed box.
Fig. 6
Fig. 6. Interactions of Gpl1 at the active site.
a, Gpl1 binds at the heart of the spliceosome where it interacts with the 5′ss and the 1585-loop of Prp8 (purple). The color scheme for protein and RNA elements follows Fig.1. b, Gpl1 residue F60 stacks with G+1 of the 5′ss. c, Rotated view showing recognition of U+2 of the 5′ss by Gpl1. d, The 1585-loop is held in position by Gpl1 residues 38–60 on one side and residues 204–209 on the other. It also directly interacts with U2–U6 helix Ia.
Fig. 7
Fig. 7. Scheme for Gpl1-mediated discard of the aberrant Bd complex.
Following the action of the Prp2–Spp2 complex, the RES, SF3a and SF3b complexes and splicing factors Cwc24 and Cwc27 are released. Sensing an aberration, Gpl1, either alone or in complex with Gih35, binds to the active site, blocking splicing progression (model 1). Alternatively, the spliceosome is targeted for disassembly by Prp16-mediated proofreading before branching, triggering Gpl1–Gih35 binding at the B* state (model 2). Concomitantly, the Ntr1 complex is recruited and Saf4 and Bis1 help stabilize the Ntr1 complex in the Bd complex. Subsequently, disassembly of the defective spliceosome can be initiated by Prp43. The two discard models 1 and 2 are marked by dashed lines.
Extended Data Fig. 1
Extended Data Fig. 1. spBd complex purification, characterization and cryo-EM processing.
a, Purification scheme for the spBd complex using a split-tag approach. b, After elution of the spBd complex from the anti-FLAG beads, the sample was analyzed using SDS-PAGE and visualized by silver staining. A representative gel from two independent experiments is shown. c, The purified spBd complex was crosslinked with BS3 and subjected to mass spectrometric analysis. A list of the components of the U5 snRNP, U2 snRNP core, NTC core, NTC related proteins, other splicing factors, Ntr1 complex, CNM complex and the associated Gih35-Gpl1 proteins identified in the spBd complex is provided. The PSM (Peptide-spectrum match) values obtained from three technical replicates are indicated. A list of the top 200 proteins identified in the sample, ranked according to label-free quantitation (LFQ) intensity, are provided in Supplementary Table 1. The proteome analysis of the spBd complex was also performed on non-crosslinked samples which yielded a similar protein composition as shown here. Proteins modelled in the spBd-I and II complexes are marked. * represents that only the C-terminal domain of Ntr1 was modelled in the spBd-I state. d, A representative cryo-EM micrograph from a total of 13,096 is shown. Scale bar represents 500 Å. e, Cryo-EM processing pipeline for the spBd complex. f, Local resolution and Fourier shell correlation curves (FSC) (0.143 cut-off) along with resolutions are reported for the consensus refinements of spBd-I and spBd-II states. g, A superposition of the FSC curves of the consensus cryo-EM map (black) and the atomic model (orange) is shown for spBd-I and spBd-II states. Source data
Extended Data Fig. 2
Extended Data Fig. 2. Comparison of spBd-II state with other spliceosome complexes.
a, Comparison of overall structures of the spBd-II state and scB* (PDB:6J6Q) shows the stable core of the spliceosome that remains largely unchanged. b, Comparison of overall structures of the spBd-II state and scB* (PDB:6J6Q). c, Comparison of overall structures of the scILS (PDB:5Y88) and hsC* (PDB:8C6J) complexes. Components differing in the four states in panels b and c are shown in color.
Extended Data Fig. 3
Extended Data Fig. 3. Inter-protein crosslinks in the spBd complex and differences between the two spBd states.
a, Schematic representation of a subset of inter-protein crosslinks originating from Gpl1, Gih35, Ntr1 complex (Ntr1, Ntr2, Prp43, Cwc23) and the CNM complex (Ctr1, Nrl1, Mtl1) obtained using the entire S. pombe proteome as a search database. See Supplementary Tables 2 and 3 for a complete list of all inter-and intra-protein crosslinks identified, respectively. Domain annotations in the proteins are shown. b, Domain architecture of Saf4. c, Homologs of scYju2. Saf4 and Cwf16 in S. pombe, CCDC94 and CCDC130 in humans share sequence homology with scYju2. The two α-helices of Saf4 visible in the spBd-II state are highlighted in blue. d, Superposition of Saf4 residues 156-177 with the spBd-II cryo-EM map. e, Superposition of Cef1 residues 379-409 with the spBd-I cryo-EM map. f, Superposition of Syf2 residues 194-215 with the spBd-I cryo-EM map. g, Superposition of Bis1 residues 188-200 and 229-236 with the spBd-II cryo-EM map is provided. h, Superimposition of Gih35 and Ntr2 with their respective focused cryo-EM maps. The distance (11.3 Å) between Cα atoms of closest residues Pro 206 (Gih35) and Ile 323 (Ntr2) is shown with a dotted line.
Extended Data Fig. 4
Extended Data Fig. 4. Gpl1 interacts with Prp8 and Gih35.
a, Interactions between the Gpl1 N-terminal region and Prp8En and Prp8Linker (including the 1585-loop). The Cα atoms of residues contacting the pre-mRNA in the active site of the spliceosome are shown as spheres. b, Gpl1 residues 123-137 form a knob and insert into Prp8RH, thus sequestering the Prp8 domain in this extreme position. An overlay of the cryo-EM map with Gpl1 residues 109-188 is provided, and the Cα atoms of Gpl1 knob residues I123 and D137 are shown as spheres. c, Interactions between the Gpl1 region including the brace loop and Prp8RT (see also panels e and f). d, Interactions between Gpl1 residues 199-234 and an interface formed by the Prp8RT, Prp8Thumb/X and Prp8Linker domains. Inset shows a zoom-in of the interactions. For simplicity, only residues from Gpl1 are labeled. e, Superimposition of Gih35-Gpl1 with the cryo-EM map. Inset shows a zoom-in with well-defined side chain densities of Gih35 and the region of Gpl1 encompassing the brace loop. f, Overview of the Gih35-Gpl1 complex with the brace helix and brace loop marked with dotted boxes. The Gpl1 knob that interacts with Prp8RH in the spBd-II state is marked by a dotted circle. A brace encompassing the brace helix and brace loop is shown in black. g, Size-exclusion chromatography profiles of Prp43+Ntr1 G-patch domain (black) and Prp43+Gpl1 G-patch domain (red) are shown (molar ratio Prp43: Ntr1/Gpl1 1:2). Fractions loaded on SDS-PAGE gels are marked. ‘arb. units’ represent arbitrary units. 1% of sample mixture before loading on size-exclusion column (L) and size-exclusion fractions A1-A5 were separated on 19% SDS-PAGE gels. Positions of Prp43 (blue), Ntr1 G-patch domain (yellow) and Gpl1 G-patch domain (red) are marked with stars. While Prp43 and Ntr1 G-patch domain co-elute in fractions A1-A2, Prp43 and Gpl1 G-patch domain elute separately in fractions A1 and A4, respectively. Excess of Ntr1 G-patch domain elutes in fractions A4-A5. A representative of two independent measurements is shown. Source data
Extended Data Fig. 5
Extended Data Fig. 5. Differences in location of proteins between the spBd-II state and other spliceosome complexes.
a-b, Conformation sampling by the Prp8RH. a, The domain arrangement of Prp8 from the scB-sc/spILS and the spBd-II state is shown. For spBd-II Prp8, an overlay of the cryo-EM map is provided. The respective PDB IDs are indicated. b, Superposition of Prp8 from the scBact, scB*, and the spBd-II complexes shows that Prp8RH undergoes a 145° rotation from the scBact to scB* state, while it undergoes a -35° rotation in the opposite direction from the scBact to the spBd-II state. This position of the Prp8RH in the spBd-II complex is fixed by the Gpl1 knob (Extended Data Fig. 4b). For simplicity, the Prp8N-domain, Prp8RT, Prp8Thumb/X, Prp8Linker and Prp8En domains of the spBd complex are shown in cartoon representation, while Prp8RH from scBact (purple), Prp8RH from scB* (teal blue) and Prp8RH from spBd-II complex (pale blue) are shown as surfaces. Structure alignment is performed on the Prp8 Large domain comprising the N-domain till the En domain. c-f, Comparison of Gpl1 (residues 199-234) in the spBd-II complex with Prp45 and Ntr2 as part of the scBact and scILS complexes, respectively, indicates an overlapping binding site on Prp8. c, Positions of Gpl1 residues 199-234 (pink) and UNK (green) in the spBd-II complex are shown. d, Position of Prp45 (light magenta) in the scBact (PDB: 7DCO) complex is shown in the same view. e, Position of the helix-turn-helix motif of Ntr2 (orange) in the scILS (PDB: 5Y88) complex is shown. f, A superposition of the spBd-II, scBact and scILS complexes shows that Gpl1 residues 199-234 and UNK in spBd-II occupy the same location as stretches of Prp45 and Ntr2 in the scBact and scILS complexes, respectively. For simplicity, only the spBd-II complex is shown in black-and-white outline representation. g, RNA helicases Gih35, Prp2, Prp16 and Prp22 bind at similar positions at the periphery of the spliceosome. Positions of Gih35, Prp2, Prp16 and Prp22 (dark blue) at the periphery of the spBd-II complex, the scBact complex (PDB: 7DCO), the scC complex (PDB: 5LJ5), and the scP complex (PDB: 6BK8) are shown. The different RNA species are shown in color and Prp8 is shown in wheat.
Extended Data Fig. 6
Extended Data Fig. 6. RNA and proteins at the active site of the spBd complex.
a, A comparison of the architecture of U2 snRNA, U5 snRNA, U6 snRNA and the pre-mRNA shows overall similarities of the spBd complex with the scBact (PDB: 7DCO) and scILS (PDB:5Y88) states. The structures are aligned on U6 snRNA. b, Schematic RNA representation for the spBd complex. Gpl1 Phe60, which stacks onto G+1 of the pre-mRNA, is shown. c, Cryo-EM map (spBd-II) shows signals for the K+ ion at the K1 site and three other structural Mg2+ ions. d, Overlays of spBd-I and spBd-II cryo-EM maps with the pre-mRNA. Insets show zoom-ins of nucleotides between positions -1 and +3 of the pre-mRNA. e, Insertion of an extra nucleotide at the active site introduces a bend in the pre-mRNA conformation (related to Fig. 5b). Yellow spheres represent centers of backbone sugar rings of scB* pre-mRNA G+1 (PDB: 6J6Q) and spBd-II pre-mRNA G+1 and the dotted line marks the distance between them as 3.9 Å. f, Gpl1 Phe60 stacks on top of the 5’ss. The cryo-EM map shows density for the K+ ion at the K1 site. g, spBd-I and -II cryo-EM maps superimposed with the 5’ss G0 and G+1 and the Gpl1 Phe60, respectively. Since the signal of the pre-mRNA at the active site is weak, alternative conformations (180° flipped) of the G0 and G+1 can be modeled. However, in both spBd-I and spBd-II states, both the alternative conformations of G0 and G+1 stack well with Gpl1 Phe60. h, U+2 of the intron is sequestered into a pocket formed by Gpl1.
Extended Data Fig. 7
Extended Data Fig. 7. RNA-seq analysis of ctr1∆ strain and spBd spliceosome RNA immunoprecipitation (RNA-IP).
a-h, RNA-seq analysis of ctr1∆ strain. a, Metagene profile (geometric average) of sense RNA levels in the indicated strains for all annotated S. pombe introns from 20 bp upstream to 20 bp downstream of 5’ ss and 3’ ss of the introns. b, Scatter plot showing average RNA coverage of all annotated introns in two biological replicates of the ctr1∆ strain. c-d, Scatter plots representing relative intron abundance in ctr1∆ compared to WT strains. c, Introns with > 30 normalized read count in both biological replicates are shown in red. d, introns were further classified into CNM-sensitive sites (red) and CNM-insensitive sites (blue). e-f, Sequence logos of 5’ss and 3’ss of CNM-sensitive and CNM-insensitive sites shown, the height of the nucleotides expresses the information content in bits. Logos are based on unscaled (“per gene”) occurrences (e) or being scaled to the normalized coverage of the upstream exon (f). g, Word cloud showing the 5’ss of CNM-sensitive introns. The height of the letters is proportional to normalized coverage of the upstream exon. h, IGV snapshot of strand-specific RNA-seq coverage of the rpl39 gene, in the indicated strains. i-k, spBd spliceosome RNA-IP. i, Gene browser view of strand-specific RNA levels at the fma1 and vma1 genes show representative examples of retained introns in the spBd spliceosome RNA-IP (light blue: replicate 1, dark blue: replicate 2). Black track shows the background signal (no-tag control for the RNA-IP). Lower panel shows the magnified view of individual strand-specific paired-end reads in the spBd RNA-IP rep1 sample (pink: read1, blue: read2). j, Metagene profile (geometric average) of sense RNA levels in the spBd spliceosome purification (light blue: replicate 1, dark blue: replicate 2) and in total RNA of wild-type strain (black line and grey shaded area), for all annotated S. pombe introns (datasets were normalized for total exon coverage). k, Scatter plot of log2 intron coverage (X-axis) versus log2 intron enrichment, compared to no-tag RNA-IP background (Y-axis). Dots represent individual introns. Blue dots represent enriched introns in the RNA-IP, red dot represents intron 1 in rpl39 gene.
Extended Data Fig. 8
Extended Data Fig. 8. Comparisons of spBd active site with that of scBact and scC*; RNA binding of Prp2 in the scBact complex and Gih35 in the spBd complex.
a-e, Comparisons of spBd active site with that of scBact and scC*. a, Prp11 and Cwc24 are bound to the active site in the scBact complex (PDB: 7DCO). Prp11 Tyr3 stacks with G-1 and Tyr155, and Phe161 of Cwc24 stack with G+1 and U+2. b, Superposition of Prp11 and Cwc24 from the scBact complex onto the spBd complex shows steric clashes between the pre-mRNA and Prp11/Cwc24. For simplicity, Gpl1 is not shown. c, The 1585-loop of Prp8 interacts with Prp11, Cwc24 and the U2/U6 duplex in the scBact complex (PDB: 7DCO). d, The 1585-loop of Prp8 comprising residues 1537-1550 (purple) in S. pombe is structured in the spBd complex as seen by the overlay with the cryo-EM map. e, Position of the 1585-loop in the scC* complex (PDB: 5WSG) is similar to that of the spBd complex (Fig. 6d). f-j, RNA binding of Prp2 in the scBact complex and Gih35 in the spBd complex. f, spBd-II cryo-EM map shows density likely corresponding to an RNA substrate bound to Gih35. g, RNA-binding to Prp2. The N-and C-hairpins of Prp2 prevent the backsliding of pre-mRNA (PDB: 7DCO). The RNA binding tunnel is outlined with dashes. h, Structure superposition of Spp2-Prp2 in the absence (PDB: 7DCP) and presence of RNA (PDB: 7DCO) show that the N- and C-hairpins undergo large movements to accommodate the RNA. The structures are aligned on the RecA1 domains. i, Structure superposition of the Gih35-Gpl1 complex with Prp2-Spp2-RNA shows that the position of the N- and C-hairpins of Gih35 in the spBd complex are compatible with RNA binding. j, A close-up view of the last nucleotide of U2 snRNA visible in the spBd complex (A30) positioned close to the RNA binding tunnel of Gih35. Superpositions with the scBact complex (PDB: 7DCO) and the scB* complex (PDB: 6J6H) show that the branch helix from either state would clash with Gih35. Given that Gih35 is bound to an RNA substrate and the branch helix is invisible in our structure, it is likely that Gih35 acts on the branch helix.
Extended Data Fig. 9
Extended Data Fig. 9. Comparison between Gih35-Gpl1 in the spBd complex and DHX35-GPATCH1 in the hsC* complex.
a, Superposition of spBd-II state with hsC* complex. For simplicity, only PRKRIP1 (green), PRP8RH (teal) and intron (orange) from hsC* complex are shown in color. Gpl1 and Gih35 from spBd complex clash with PRKRIP1 and Prp8RH from hsC* complex. For orientation, pre-mRNA U+2 and Gpl1 Phe60 (Cα atom as sphere) are marked. b, FAM32A is at the catalytic center in hsC* (marked by a black arrow), which is incompatible with the pre-mRNA 5’ss and Gpl1 in the spBd complex. c and d, Sequence alignments of Gpl1 with GPATCH1 (c) and Gih35 with DHX35 (d), respectively. Yellow dots mark the lysine residues of GPATCH1/DHX35 which crosslink to other proteins as listed in panels (e) and (f). e, All crosslinks between GPATCH1 and DHX35 reported for hsC* complex are satisfied (distance between Cα atoms of crosslinked residues < 24 Å) in the spBd complex using corresponding amino acid positions from S. pombe orthologues (listed in brackets, shown as red arrows). Cef1 and CDC5L superimpose well and the crosslinks from CDC5L to Gpl1/Gih35 are also satisfied. Cα atoms for the corresponding residues from Gpl1, Gih35 and CDC5L are shown as yellow spheres. f, All crosslinks between GPATCH1 and Prp8RH reported for hsC* complex are unsatisfied (distance between Cα atoms of crosslinked residues > 24 Å, marked by dashed red arrows) in the spBd-II complex due to the differences in location of Prp8RH between spBd-II complex and hsC* complex.

References

    1. Brody, E. & Abelson, J. The ‘spliceosome’: yeast pre-messenger RNA associates with a 40S complex in a splicing-dependent reaction. Science228, 963–967 (1985). - PubMed
    1. Frendewey, D. & Keller, W. Stepwise assembly of a pre-mRNA splicing complex requires U-snRNPs and specific intron sequences. Cell42, 355–367 (1985). - PubMed
    1. Grabowski, P. J., Seiler, S. R. & Sharp, P. A. A multicomponent complex is involved in the splicing of messenger RNA precursors. Cell42, 345–353 (1985). - PubMed
    1. Will, C. L. & Luhrmann, R. Spliceosome structure and function. Cold Spring Harb. Perspect. Biol.3, a003707 (2011). - PMC - PubMed
    1. Shi, Y. Mechanistic insights into precursor messenger RNA splicing by the spliceosome. Nat. Rev. Mol. Cell Biol.18, 655–670 (2017). - PubMed

MeSH terms

Substances