. 2025 Feb;57(1):235-248.
doi: 10.1038/s12276-024-01388-8. Epub 2025 Jan 20.

Exosome-based targeted delivery of NF-κB ameliorates age-related neuroinflammation in the aged mouse brain

Affiliations

Exosome-based targeted delivery of NF-κB ameliorates age-related neuroinflammation in the aged mouse brain

Chae-Jeong Lee et al. Exp Mol Med. 2025 Feb.

Abstract

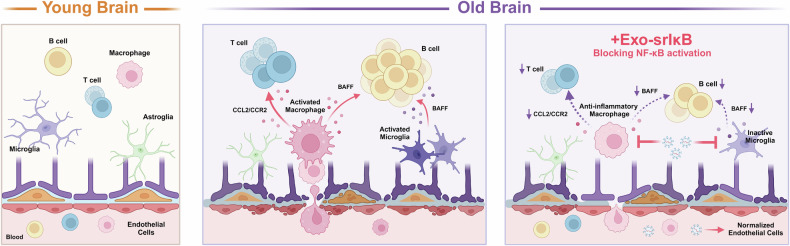
Neuroinflammation, a significant contributor to various neurodegenerative diseases, is strongly associated with the aging process; however, to date, no efficacious treatments for neuroinflammation have been developed. In aged mouse brains, the number of infiltrating immune cells increases, and the key transcription factor associated with increased chemokine levels is nuclear factor kappa B (NF-κB). Exosomes are potent therapeutics or drug delivery vehicles for various materials, including proteins and regulatory genes, to target cells. In the present study, we evaluated the therapeutic efficacy of exosomes loaded with a nondegradable form of IκB (Exo-srIκB), which inhibits the nuclear translocation of NF-κB to suppress age-related neuroinflammation. Single-cell RNA sequencing revealed that these anti-inflammatory exosomes targeted macrophages and microglia, reducing the expression of inflammation-related genes. Treatment with Exo-srIκB also suppressed the interactions between macrophages/microglia and T and B cells in the aged brain. We demonstrated that Exo-srIκB successfully alleviates neuroinflammation by primarily targeting activated macrophages and partially modulating the functions of age-related interferon-responsive microglia in the brain. Thus, our findings highlight Exo-srIκB as a potential therapeutic agent for treating age-related neuroinflammation.


Conflict of interest statement

Competing interests: C.C. is the founder and shareholder of ILIAS Biologics, Inc. The remaining authors declare no competing interests.

Figures

Fig. 1
Fig. 1. Increased inflammatory responses in aged mouse brains.
a Immunohistochemical staining for Iba-1 in the cerebral cortex of young (2–3 months old) and old (21–22 months old) mice (arrow). Scale bars = 200 µm (A, C) and 50 µm (B, D). b The relative intensity of Iba-1-immunopositive cells in the brains of young and old mice was quantified (n = 6, means ± SDs, *p-value < 0.05). c Cytokine array results for the cerebral cortex of young (3 months old) and old (15 months old) mice. The relative expression of the protein spots detected by the array is presented in a graph based on a comparison of the signal intensities between young and old mice. d Immunoblots showing the levels of IκBα and p65 in young and old mice (n = 6). Tubulin was used as the loading control. The graph presents the intensities of IκBα normalized to those of tubulin (means ± SDs, **p-value < 0.01). ei Bulk RNA sequencing of the cerebral cortex of young (3 month-old, n = 6 (4 females, 2 males)) and old (15 month-old, n = 7 (3 females, 4 males)) mice. e Principal component analysis (PCA) plot of the RNA-seq data obtained from the brains of young and old mice. f Volcano plot showing −log10 (adjusted p-value) and log2 (fold change) values for all genes, with those that were significantly upregulated in old mice (Benjamini‒Hochberg (BH)-adjusted p-value < 0.05 and log2 fold change > 2) indicated by red highlighting, and those that are significantly downregulated in old mice (BH-adjusted p-value < 0.05 and log2 fold change < −2) indicated by blue highlighting. g Gene Ontology (GO) terms enriched among significantly upregulated differentially expressed genes (DEGs) in old mice. The dot color and size represent the p-value and gene ratio (gene count in a specific term divided by the total number of genes), respectively. The top 10 GO terms, according to the gene ratio with BH-adjusted p-values < 0.05, are listed. h Heatmap showing the results of gene set variation analysis (GSVA). The color represents the Z scored and normalized enrichment score. i Gene set enrichment analysis (GSEA) of GO biological processes for significant DEGs. Significant GO terms (BH-adjusted p-value < 0.05) involved in the immune response are presented.
Fig. 2
Fig. 2. Single-cell transcriptomic analysis of brains from mice in the four different groups.
a Experimental protocol. b Cytokine array results for the cerebral cortex of old Exo-Naïve-treated and Exo-srIκB-treated mice. Heatmap of the relative expression of the protein spots detected by the array based on a comparison of the signal intensities between old Exo-Naïve-treated and Exo-srIκB-treated mice. c Single-cell RNA sequencing (scRNA-seq) of whole brains obtained from Exo-Naïve/Exo-srIκB-treated young (2–3 months old, n = 2 per group) and old (18–22 months old, n = 2 per group) female mice. Uniform manifold approximation (UMAP) plots of cells (n = 29,719) from all groups. The cells are colored based on their respective lineages. d UMAP visualization of each lineage showing the expression of well-known representative marker genes. e (Top panel) Dot plot of representative marker genes for molecularly identified cell types. The dot size and color represent the percentage of cells expressing specific marker genes within each cell type and Z scores for normalized expression values, respectively. (Bottom panel) Bar plots showing the proportion of cells per cluster across the different groups.
Fig. 3
Fig. 3. Changes in the cell type and cell state composition of immune cells were observed across the four different groups.
a Uniform manifold approximation (UMAP) plot of immune cells (n = 16,490). b Proportions of cell types (left panel) among immune cells and cell states (right panel) among microglia or macrophages across the four groups. A chi-square test was conducted to determine p-values. c, d Violin plots showing the interferon response scores (c) and activation scores (d) among the different states of microglia or macrophages. *** indicates an adjusted p-value < 0.001 (one-way ANOVA with Bonferroni’s multiple comparison correction) between two compared groups. e UMAP plot with the trajectories of macrophages, colored based on the pseudotime. f Changes in the expression levels of selected genes within macrophages across the pseudotime axis. Individual dots represent individual cells, which are colored based on the corresponding cell state, and black lines represent trends in the expression levels of selected genes. g Heatmap presenting the identified modules of genes whose expression changed significantly along the trajectory of macrophages. The indicated coloration represents normalized, aggregated, and Z scores for the expression levels of specific modules. h Bar plots present the top 5 significantly enriched Gene Ontology (GO) terms within each module. GO terms with Benjamini‒Hochberg adjusted p-values < 0.05 were considered significant, and the terms were ordered by −log10 (adjusted p-value). i Box plots represent the distribution of the pseudotime of macrophages across four different groups. *** indicates an adjusted p-value < 0.001 (one-way ANOVA with Bonferroni’s multiple comparison correction) between two compared groups.
Fig. 4
Fig. 4. Changes in the molecular signatures and cellular processes of microglia and macrophages across the four different groups.
a Number of significant DEGs between Exo-Naïve-treated old vs. young mice and Exo-srIκB-treated vs. Exo-Naïve-treated old mice in each immune cell type. Significant DEGs were defined as genes with a Benjamini‒Hochberg (BH)-adjusted p-value < 0.05 and an absolute value of log2-fold change  > 0.5 between the two compared groups. b Violin plots display the scores of selected molecular signatures across the four groups. The interferon response score was calculated within MG2. The microglial activation score was calculated for MG1A. The macrophage activation score was calculated for all states of macrophages. *** indicates an adjusted p-value < 0.001, and ns indicates no statistical significance (one-way ANOVA with Bonferroni’s multiple comparison correction) between two compared groups. c Gene Ontology (GO) terms that were enriched among the significantly upregulated DEGs in the microglia and macrophages from the old Exo-Naïve-treated mice compared with those in the microglia and macrophages from the young Exo-Naïve-treated mice. The dot color and size represent the p-value and gene ratio, respectively. The top 10 GO terms, according to the gene ratio with BH-adjusted p-values < 0.05, are listed. d GO terms that were enriched among significantly downregulated DEGs in microglia and macrophages from old Exo-srIκB-treated mice compared with those from old Exo-Naïve-treated mice. The top 10 GO terms, according to the gene ratio with BH-adjusted p-values < 0.05, are listed.
Fig. 5
Fig. 5. Analysis of cell‒cell communication among immune cells across the four distinct groups.
a, b Signaling networks with a greater pathway distance in immune cells between Exo-Naïve-treated old vs. young mice (a) and Exo-srIκB-treated vs. Exo-Naïve-treated old mice (b). The pathway distance of specific signaling networks was based on their Euclidean distances in the shared two-dimensional space according to functional similarity. c Bubble plots illustrating ligand‒receptor pairs involved in interactions between microglia or macrophages and T cells or B cells that were significantly increased in old Exo-Naïve-treated mice compared with young Exo-Naïve-treated mice. The dot color and size denote the probabilities of communication from specific cell types to other cell types and the corresponding p-values, respectively. d Bubble plots illustrating ligand‒receptor pairs involved in interactions between microglia or macrophages and T cells or B cells that exhibited a significant decrease in old Exo-srIκB-treated mice compared with old Exo-Naïve-treated mice. The dot color and size denote the probabilities of communication from specific cell types to other cell types and the corresponding p-values, respectively. e, f (Left panels) Circle plots depict the interactions of selected signaling networks from microglia and macrophages to T and B cells across the four groups. Edge colors represent the source cell types of the interactions, and edge widths are proportional to the interaction strength. (Right panels) RAW264.7 cells (M) were stimulated with LPS (1 µg/ml) and Exo-srIκB (1 × 107 particles) for 24 h, and then the conditioned media was used to treat EL4 (T) and FB2 (B) cells for 24 h. The expression of the Ccl2, Ccr2, Tnfsf13b, and Tnfrsf13b mRNAs was analyzed via qRT‒PCR and normalized to Gapdh expression (means ± SDs, *p-value < 0.05, **p-value < 0.01, and ***p-value < 0.001). Statistical significance was assessed using one-way ANOVA with Tukey’s multiple comparisons test.
Fig. 6
Fig. 6
Schematic model depicting the role of Exo-srIκB in age-related neuroinflammation.

References

    1. McHugh, D. & Gil, J. Senescence and aging: causes, consequences, and therapeutic avenues. J. Cell Biol.217, 65–77 (2018). - PMC - PubMed
    1. Finger, C. E., Moreno-Gonzalez, I., Gutierrez, A., Moruno-Manchon, J. F. & McCullough, L. D. Age-related immune alterations and cerebrovascular inflammation. Mol. Psychiatry27, 803–818 (2022). - PMC - PubMed
    1. Rawji, K. S. et al. Immunosenescence of microglia and macrophages: impact on the ageing central nervous system. Brain139, 653–661 (2016). - PMC - PubMed
    1. Hammond, T. R. et al. Single-cell RNA sequencing of microglia throughout the mouse lifespan and in the injured brain reveals complex cell-state changes. Immunity50, 253–271.e256 (2019). - PMC - PubMed
    1. Dong, Y. et al. Single-cell and spatial RNA sequencing identify perturbators of microglial functions with aging. Nat. Aging2, 508–525 (2022). - PubMed

LinkOut - more resources