. 2025 Jan 20;8(1):91.
doi: 10.1038/s42003-025-07526-w.

Glioblastoma-derived migrasomes promote migration and invasion by releasing PAK4 and LAMA4

Affiliations

Glioblastoma-derived migrasomes promote migration and invasion by releasing PAK4 and LAMA4

Zhe Huang et al. Commun Biol. .

Abstract

Almost all high-grade gliomas, particularly glioblastoma (GBM), are highly migratory and aggressive. Migrasomes are organelles produced by highly migratory cells capable of mediating intercellular communication. Thus, GBM cells may produce migrasomes during migration. However, it remains unclear whether migrasomes can influence GBM migration and invasion. In this study, we observed the presence and formation of migrasomes in GBM cells. We found that expression levels of key migrasome formation factor, tetraspanin 4 (TSPAN4), correlated positively with pathological grade and poor prognosis of GBM based on the databases and clinical samples analysis. Subsequently, we knocked down TSPAN4 and found that GBM cell migration and invasion were significantly inhibited due to the reduced formation of migrasomes. We further confirmed that migrasomes are enriched in extracellular matrix (ECM)-related proteins such as p21-activating kinase 4 (PAK4) and laminin alpha 4 (LAMA4). Our experimental results suggest that migrasomes promote GBM cells migration by releasing such proteins into the extracellular space. Overall, we identified migrasomes in GBM and the molecular mechanisms by which they regulate them, providing potential targets for treating GBM.


Conflict of interest statement

Competing interests: The authors declare no competing interests.

Figures

Fig. 1
Fig. 1. Detection of migrasomes in glioblastoma (GBM).
a Confocal images of LN229 cells transfected with TSPAN4-GFP. Scale bar, 10 μm. b Ten cells were randomly selected from each of the three independent dishes, and the number of migrasomes and the length of retractile fibers formed per cell were quantified. c Transmission electron microscopy (TEM) image of LN229 cells. Scale bar, 2 μm. Boxed regions are enlarged in the small panels. Scale bar, 200 nm. d LN229 cells were grown on cover slips and observed by field emission scanning electron microscope (SEM). Scale bar, 5 μm. Boxed regions are enlarged in the small panels. Scale bar, 1 μm. e Migrasome Formation. Time-lapse images were acquired with a confocal microscope after LN229 cells transfected with TSPAN4-GFP were cultured for 6 h. Scale bar, 10 μm. f The U87, T98, U251 and U373 cells were stained with wheat germ agglutinin (WGA) and subsequently visualized. Scale bar, 20 μm. g The number of migrasomes and the length of retractile fibers in each field of view in 1 f were quantified.
Fig. 2
Fig. 2. Correlation of increased TSPAN4 expression with glioma malignancy and poor patient prognosis.
a Differential mRNA levels of TSPAN4 in normal (n = 10) and GBM (n = 528) samples based on the TCGA dataset and non-GBM (n = 186) and GBM (n = 139) samples from the CGGA database. ***P < 0.001. ****P < 0.0001. b Expression profile of TSPAN4 in gliomas of different clinicopathological grades in the TCGA (n = 1013) and CGGA databases (n = 201). **P < 0.01. ***P < 0.001. ****P < 0.0001. c Expression features of TSPAN4 in gliomas with IDH status in the TCGA (n = 538) and CGGA (n = 324) databases. ***P < 0.001. ****P < 0.0001. d The protein levels of TSPAN4 were analyzed in human glioma patient samples (n = 6) and normal brain tissues (n = 6) using Western blot analysis. β-Actin was used as a loading control. ***P < 0.001. e Kaplan–Meier analysis for correlation between TSPAN4 mRNA levels and survival of patients with gliomas in the TCGA datasets. f Kaplan–Meier analysis for correlation between TSPAN4 mRNA levels and survival of patients with gliomas in the CGGA datasets.
Fig. 3
Fig. 3. TSPAN4 regulates the migration and invasion of GBM cells.
a LN229 cells were transfected with lentivirus, and the abundance of TSPAN4 was analyzed using a Western blot. GAPDH was used as a loading control. ***P < 0.001. b WGA was used to label migrasomes in NC and Kd-TSPAN4 cells, which were then imaged by confocal microscopy. Scale bar, 50 µm. Boxed regions are enlarged in the small panels. Scale bar, 20 µm. c The number of migrasomes from 3b was quantified. ****P < 0.0001. d Representative images of the wound-healing assay using NC and Kd-TSPAN4 cells are presented. The quantified scratch coverage was analyzed. Data are presented as the mean percentage of control (0 h). **P < 0.01, ****P < 0.0001. e Cells that adhered to the underside of the Transwell membrane were stained with crystal violet. Scale bar, 50 μm. The number of migrating and invading cells were quantified. ****P < 0.0001. f Representative hematoxylin and eosin-stained sections of mouse brain after inoculation with NC or Kd-TSPAN4 cells, scale bar, 1 mm; The junction between normal and tumor tissue is enlarged in the small panels, scale bar, 200 μm. The tumor area in the mouse brain was quantified using ImageJ 1.53t software, **P < 0.01.
Fig. 4
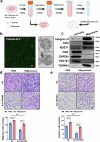
Fig. 4. Enhancement of GBM migration and invasion by Migrasomes.
a Schematic diagram of the migrasome purification procedure. Created in BioRender. Ginhg, D. (2024) https://BioRender.com/u10r305. b Images of migrasomes purified from LN229 cells. Including confocal images of migrasomes purified from LN229 cells expressing TSPAN4-GFP; scale bar, 10 μm. And TEM image of migrasomes isolated from LN229 cells; scale bar, 0.2 μm. c Western blot analysis of cell bodies and migrasomes with the indicated antibodies. d NC and Kd-TSPAN4 cells adhered to the bottom of the Transwell membrane were stained with crystal violet. Scale bar, 100 µm. Migration cells were quantified as the mean percentage of scrambled control. ns P > 0.05; ****P < 0.0001. e NC and Kd-TSPAN4 cells adhered to the bottom of the Transwell membrane with added matrixgel were stained with crystal violet. Scale bar, 100 µm. Invasion cells were quantified as the mean percentage of scrambled control. ns P > 0.05; ****P < 0.0001.
Fig. 5
Fig. 5. ECM-related factors contained in GBM migrasomes.
a Volcano plot of the quantification of TMT-labelled proteins through mass spectrometry. Red dots indicate a migrasome with a cell abundance ratio of >2 (P < 0.05), while blue dots indicate a migrasome with a cell abundance ratio of <0.5 (P < 0.05). The experiment was performed independently three times (n = 3). PAK4 and LAMA4 are labeled separately. A two-tailed, two-sample, unequal variance t-test was used in Excel to calculate the P values. b, d The abundance of the indicated proteins in 5a was analyzed. P values were calculated using a one-tailed, two-sample unequal variance t-test. The P values were as follows: histone (P = 0.000215), integrin (P = 0.000379), tetraspanin (P = 0.000556), cytokines (P = 0.001711), PAK4 (P = 0.001885), LAMA4 (P = 0.008333), and ELP6 (P = 0.000181). c For the gene ontology (GO) enrichment analysis at the biological process (BP) level of the red-dot proteins in 5a, the pathways associated with migration are highlighted in red. e Western blot was used to analyze cell body and migrasome proteins with anti-LAMA4 and anti-PAK4 antibodies. Two batches of cell body and migrasome proteins were extracted. CB: cell body. Mig: migrasome. f LN229 cells were visualized using confocal microscopy after staining with WGA, anti-LAMA4, and anti-PAK4 antibodies. Scale bar, 10 μm. High magnification images of the migrasomes are shown in the white boxes. Scale bar, 2 μm. For the co-localization analysis of the boxed region, the arrows indicate co-localization. g Staining of cells migrating/invading to the bottom of Transwell chambers using crystal violet. Cells were treated with PBS or recombinant proteins PAK4 and LAMA4. ***P < 0.001. ****P < 0.0001.
Fig. 6
Fig. 6. Promotion of GBM migration by migrasomes via PAK4 and LAMA4.
a NC, Kd-LAMA4, and Kd-PAK4 cells were stained with WGA and the indicated antibodies and visualized using confocal microscopy. Scale bar, 10 μm. High magnification images of the migrasomes are shown in the white boxes. Scale bar, 2 μm. b Statistics of the amount of PAK4/ LAMA4 released into the supernatant by cells in the NC and Kd-TSPAN4 groups. ****P < 0.0001. c The staining of cells migrating to the bottom of the chambers in the NC and Kd-PAK4 groups after adding different migrasomes was observed using crystal violet. Scale bar, 50 μm. d The staining of cells migrating to the bottom of the chambers in the NC and Kd-LAMA4 groups after adding different migrasomes was observed using crystal violet. Scale bar, 50 μm.

References

    1. Weller, M. et al. Glioma. Nat. Rev. Dis. Prim.1, 15017 (2015). - PubMed
    1. Wefel, J. S., Noll, K. R. & Scheurer, M. E. Neurocognitive functioning and genetic variation in patients with primary brain tumours. Lancet Oncol.17, e97–e108 (2016). - PMC - PubMed
    1. Xu, X. et al. PBX3/MEK/ERK1/2/LIN28/let-7b positive feedback loop enhances mesenchymal phenotype to promote glioblastoma migration and invasion. J. Exp. Clin. Cancer Res37, 158 (2018). - PMC - PubMed
    1. Janjua, T. I. et al. Frontiers in the treatment of glioblastoma: Past, present and emerging. Adv. Drug Deliv. Rev.171, 108–138 (2021). - PubMed
    1. Aldape, K., Zadeh, G., Mansouri, S., Reifenberger, G. & von Deimling, A. Glioblastoma: pathology, molecular mechanisms and markers. Acta Neuropathol.129, 829–848 (2015). - PubMed