

Integration of CRISPR/dCas9-Based methylation editing with guide positioning sequencing identifies dynamic changes of mrDEGs in breast cancer progression
- PMID: 39833630
- PMCID: PMC11747065
- DOI: 10.1007/s00018-024-05562-z
Integration of CRISPR/dCas9-Based methylation editing with guide positioning sequencing identifies dynamic changes of mrDEGs in breast cancer progression
Abstract
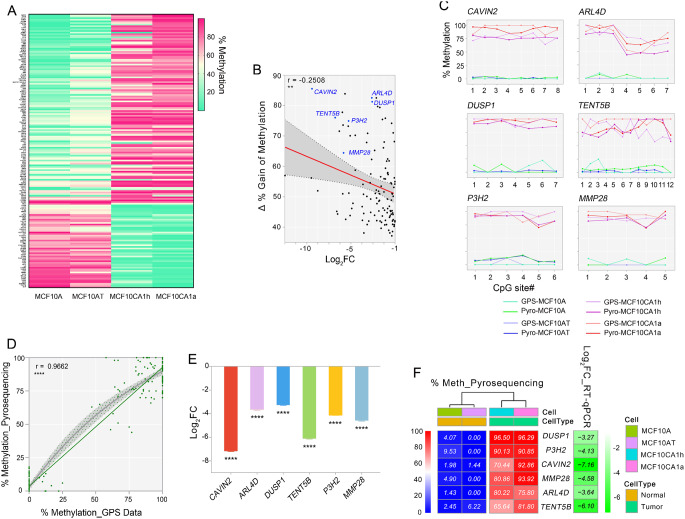
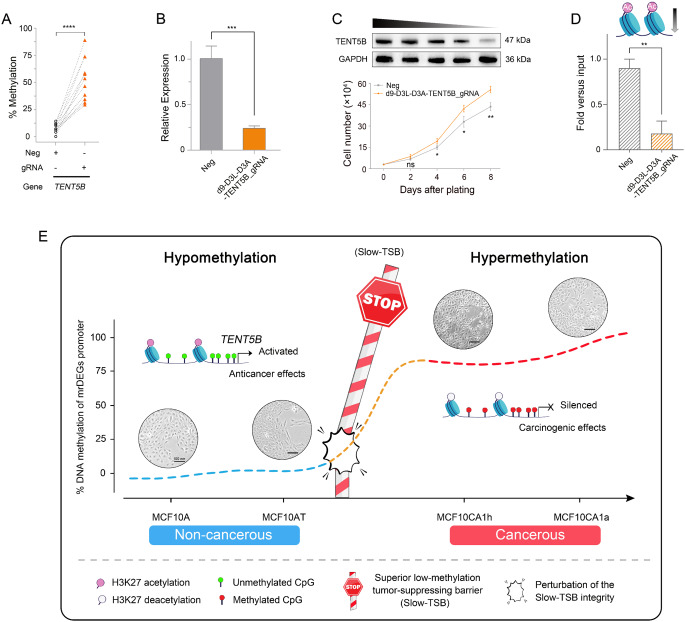
Dynamic changes in DNA methylation are prevalent during the progression of breast cancer. However, critical alterations in aberrant methylation and gene expression patterns have not been thoroughly characterized. Here, we utilized guide positioning sequencing (GPS) to conduct whole-genome DNA methylation analysis in a unique human breast cancer progression model: MCF10 series of cell lines (representing benign/normal, atypical hyperplasia, and metastatic carcinoma). By integrating with mRNA-seq and matched clinical expression data from The Cancer Genome Atlas (TCGA) and the Gene Expression Omnibus (GEO), six representative methylation-related differentially expressed genes (mrDEGs) were identified, including CAVIN2, ARL4D, DUSP1, TENT5B, P3H2, and MMP28. To validate our findings, we independently developed and optimized the dCas9-DNMT3L-DNMT3A system, achieving a high efficiency with a 98% increase in methylation at specific sites. DNA methylation levels significantly increased for the six genes, with CAVIN2 at 67.75 ± 1.05%, ARL4D at 53.29 ± 6.32%, DUSP1 at 57.63 ± 8.46%, TENT5B at 44.00 ± 5.09%, P3H2 at 58.50 ± 3.90%, and MMP28 at 49.60 ± 5.84%. RT-qPCR confirmed an inverse correlation between increased DNA methylation and gene expression. Most importantly, we mimicked tumor progression in vitro, demonstrating that transcriptional silencing of the TENT5B promotes cell proliferation in MCF10A cells owing to the crosstalk between hypermethylation and histone deacetylation. This study unveils the practical implications of DNA methylation dynamics of mrDEGs in reshaping epigenomic features during breast cancer malignant progression through integrated data analysis of the methylome and transcriptome. The application of the CRISPR/dCas9-based methylation editing technique elucidates the regulatory mechanisms and functional roles of individual genes within the DNA methylation signature, providing valuable insights for understanding breast cancer pathogenesis and facilitating potential therapeutic approaches in epigenome editing for patients with breast cancer.
Keywords: Breast cancer progression; CRISPR/dCas9; DNA methylation; Epigenetic modification; Guide positioning sequencing.
© 2024. The Author(s).
Conflict of interest statement
Declarations. Ethical approval: Not applicable. Consent to participate: Not applicable. Consent to publish: Not applicable. Open access: This article is licensed under a Creative Commons Attri- bution 4.0 International License, which permits use, sharing, adapta- tion, distribution and reproduction in any medium or format, as long as you give appropriate credit to the original author(s) and the source, provide a link to the Creative Commons licence, and indicate if changes were made. The images or other third party material in this article are included in the article’s Creative Commons licence, unless indicated otherwise in a credit line to the material. If material is not included in the article’s Creative Commons licence and your intended use is not permitted by statutory regulation or exceeds the permitted use, you will need to obtain permission directly from the copyright holder. To view a copy of this licence, visit http://creativeco mmons. org/ licen ses/ by/4. 0/. Conflict of interest: The authors have no relevant financial or non-financial interests to disclose.
Figures


Similar articles
-
CRISPR/Cas-mediated macromolecular DNA methylation editing: Precision targeting of DNA methyltransferases in cancer therapy.Int J Biol Macromol. 2025 May;308(Pt 2):142401. doi: 10.1016/j.ijbiomac.2025.142401. Epub 2025 Mar 23. Int J Biol Macromol. 2025. PMID: 40132699 Review.
-
Ezh2-dCas9 and KRAB-dCas9 enable engineering of epigenetic memory in a context-dependent manner.Epigenetics Chromatin. 2019 May 3;12(1):26. doi: 10.1186/s13072-019-0275-8. Epigenetics Chromatin. 2019. PMID: 31053162 Free PMC article.
-
DNA epigenome editing using CRISPR-Cas SunTag-directed DNMT3A.Genome Biol. 2017 Sep 18;18(1):176. doi: 10.1186/s13059-017-1306-z. Genome Biol. 2017. PMID: 28923089 Free PMC article.
-
Determinants of heritable gene silencing for KRAB-dCas9 + DNMT3 and Ezh2-dCas9 + DNMT3 hit-and-run epigenome editing.Nucleic Acids Res. 2022 Apr 8;50(6):3239-3253. doi: 10.1093/nar/gkac123. Nucleic Acids Res. 2022. PMID: 35234927 Free PMC article.
-
CRISPR/Cas mediated epigenome editing for cancer therapy.Semin Cancer Biol. 2022 Aug;83:570-583. doi: 10.1016/j.semcancer.2020.12.018. Epub 2021 Jan 6. Semin Cancer Biol. 2022. PMID: 33421620 Review.
References
-
- Sung H, Ferlay J, Siegel RL, Laversanne M, Soerjomataram I, Jemal A, Bray F, Global Cancer S (2020) GLOBOCAN Estimates of Incidence and Mortality Worldwide for 36 Cancers in 185 Countries. CA Cancer J Clin. 2021;71(3):209–249. doi: 10.3322/caac.21660. Epub 2021 Feb 4. PMID: 33538338 - PubMed
-
- Lin LH, Tran I, Yang Y, Shen G, Miah P, Cotzia P, Roses D, Schnabel F, Darvishian F, Snuderl M (2023) DNA methylation identifies epigenetic subtypes of triple-negative breast cancers with distinct clinicopathologic and molecular features. Mod Pathol 36(11):100306. 10.1016/j.modpat.2023.100306Epub 2023 Aug 17. PMID: 37595637 - PubMed
-
- Starcevic SL, Elferink C, Novak RF (2001) Progressive resistance to apoptosis in a cell lineage model of human proliferative breast disease. J Natl Cancer Inst. 93(10):776– 82. 10.1093/jnci/93.10.776. PMID: 11353788 - PubMed
-
- Santner SJ, Dawson PJ, Tait L, Soule HD, Eliason J, Mohamed AN, Wolman SR, Heppner GH, Miller FR (2001) Malignant MCF10CA1 cell lines derived from premalignant human breast epithelial MCF10AT cells. Breast Cancer Res Treat. 65(2):101– 10. 10.1023/a:1006461422273. PMID: 11261825 - PubMed
-
- Puleo J, Polyak K (2021) The MCF10 model of breast tumor progression. Cancer Res 81(16):4183–4185. 10.1158/0008-5472.CAN-21-1939 - PubMed
MeSH terms
Grants and funding
LinkOut - more resources
Full Text Sources
Medical
Molecular Biology Databases
Miscellaneous
