. 2025 Jan 20;25(1):34.
doi: 10.1186/s12866-024-03721-7.

Fecal occult blood affects intestinal microbial community structure in colorectal cancer

Affiliations

Fecal occult blood affects intestinal microbial community structure in colorectal cancer

Wu Guodong et al. BMC Microbiol. .

Abstract

Background: Gut microbes have been used to predict CRC risk. Fecal occult blood test (FOBT) has been recommended for population screening of CRC.

Objective: To analyze the effects of fecal occult blood test (FOBT) on gut microbes.

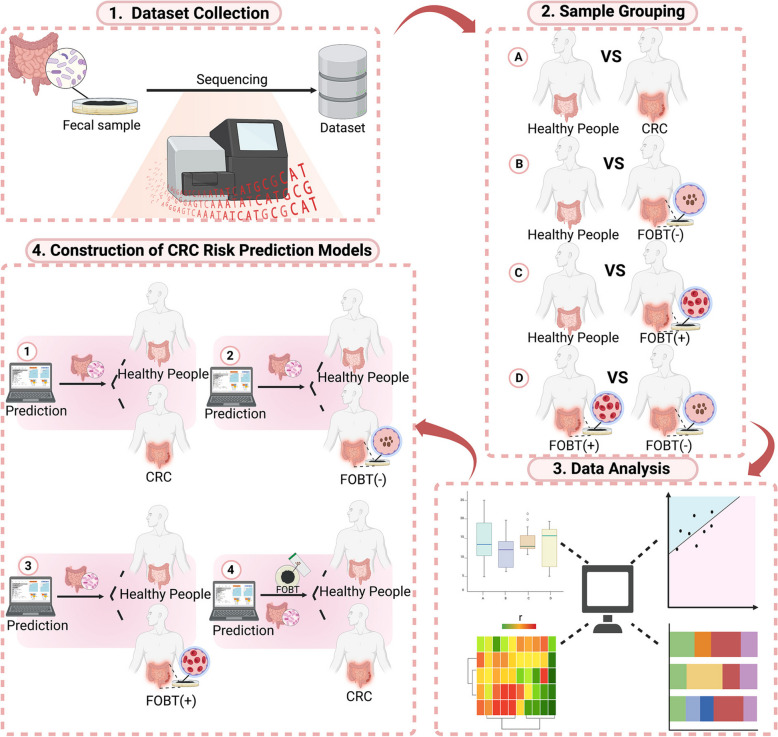
Methods: Fecal samples from 107 healthy individuals (FOBT-negative) and 111 CRC patients (39 FOBT-negative and 72 FOBT-positive) were included for 16 S ribosomal RNA sequencing. Based on the results of different FOBT, the community structure and diversity of intestinal bacteria in healthy individuals and CRC patients were analyzed. Characteristic gut bacteria were screened, and various machine learning algorithms were applied to construct CRC risk prediction models.

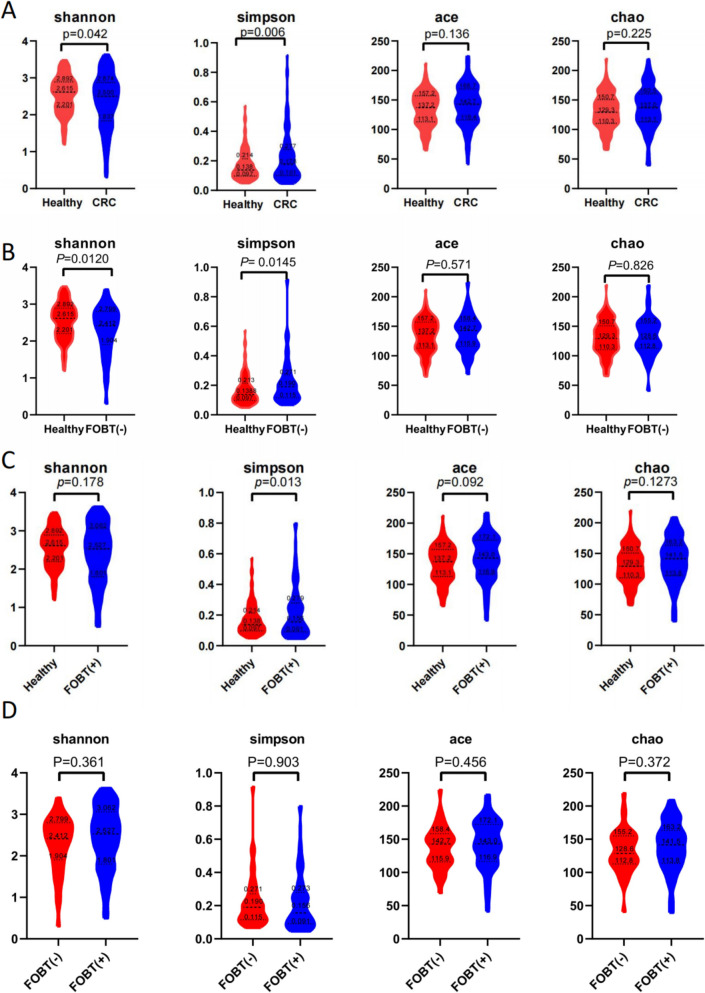
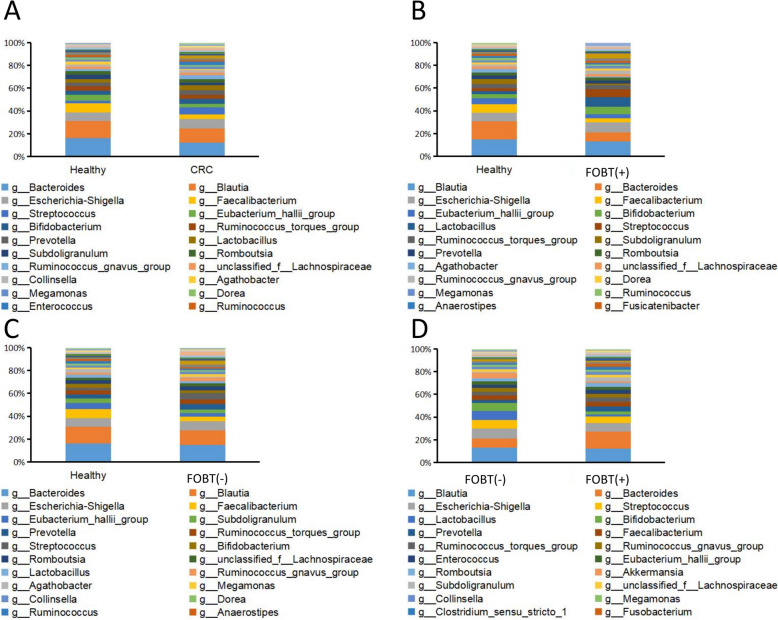
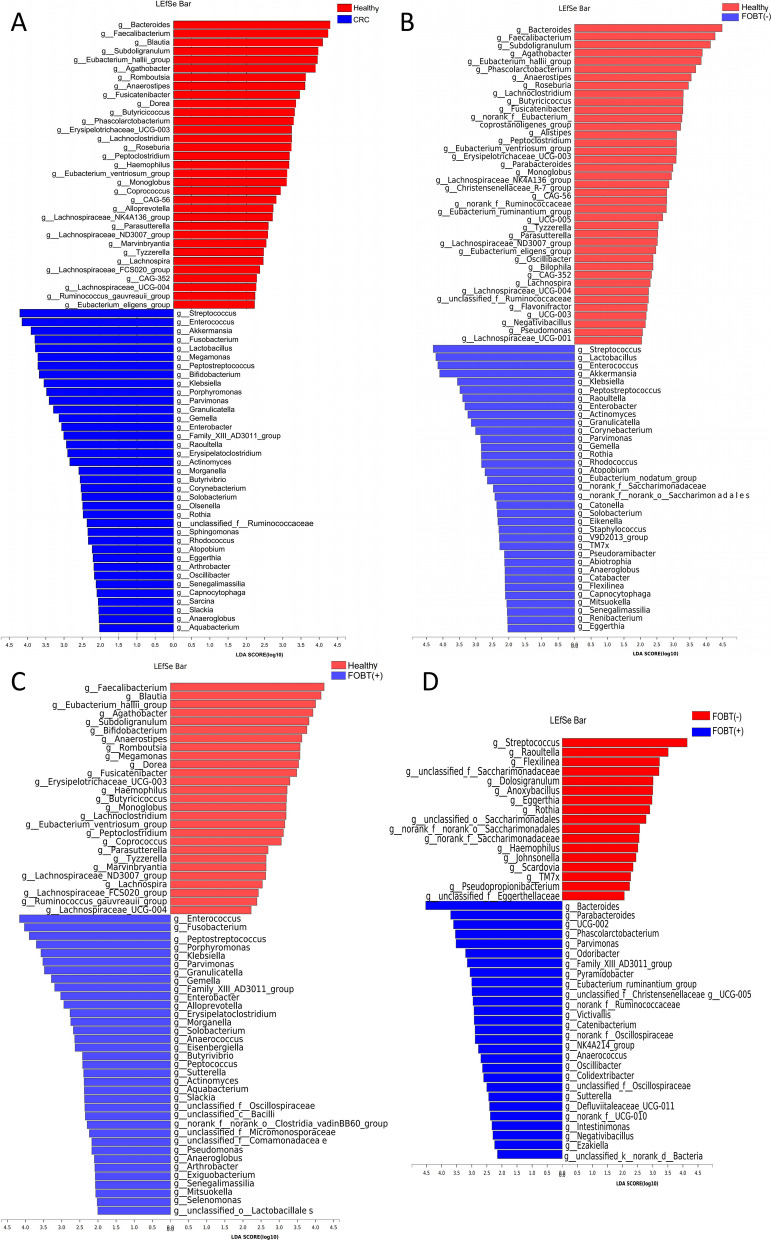
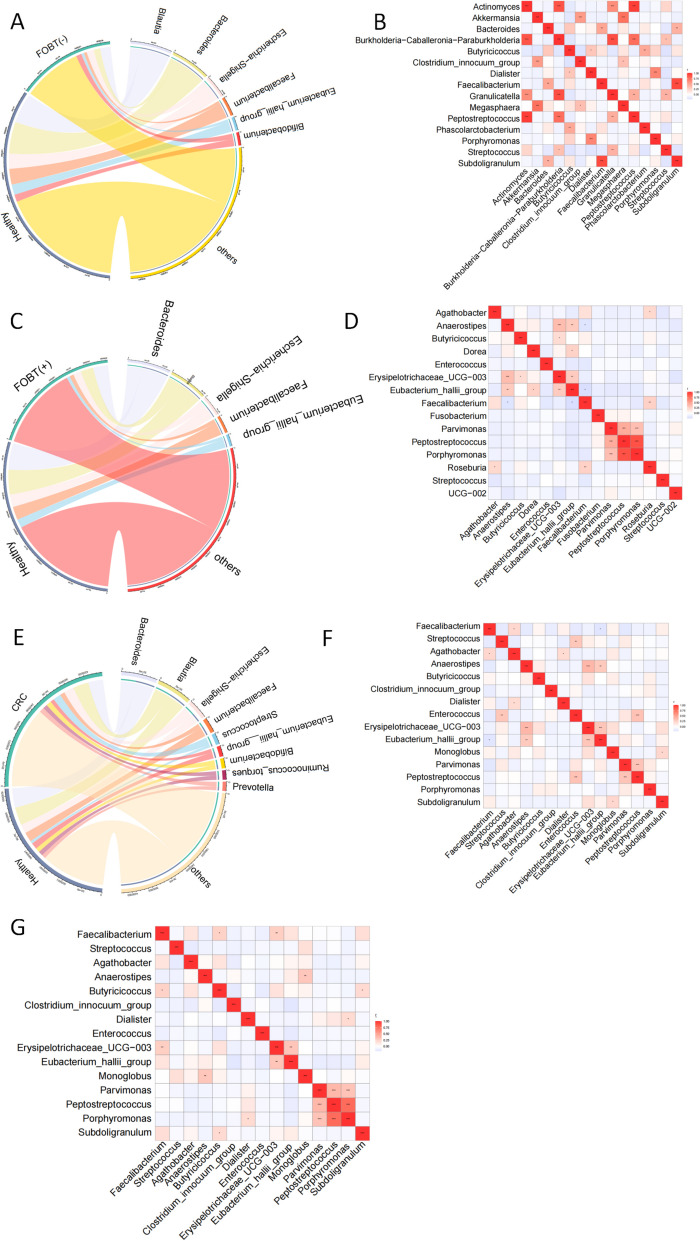
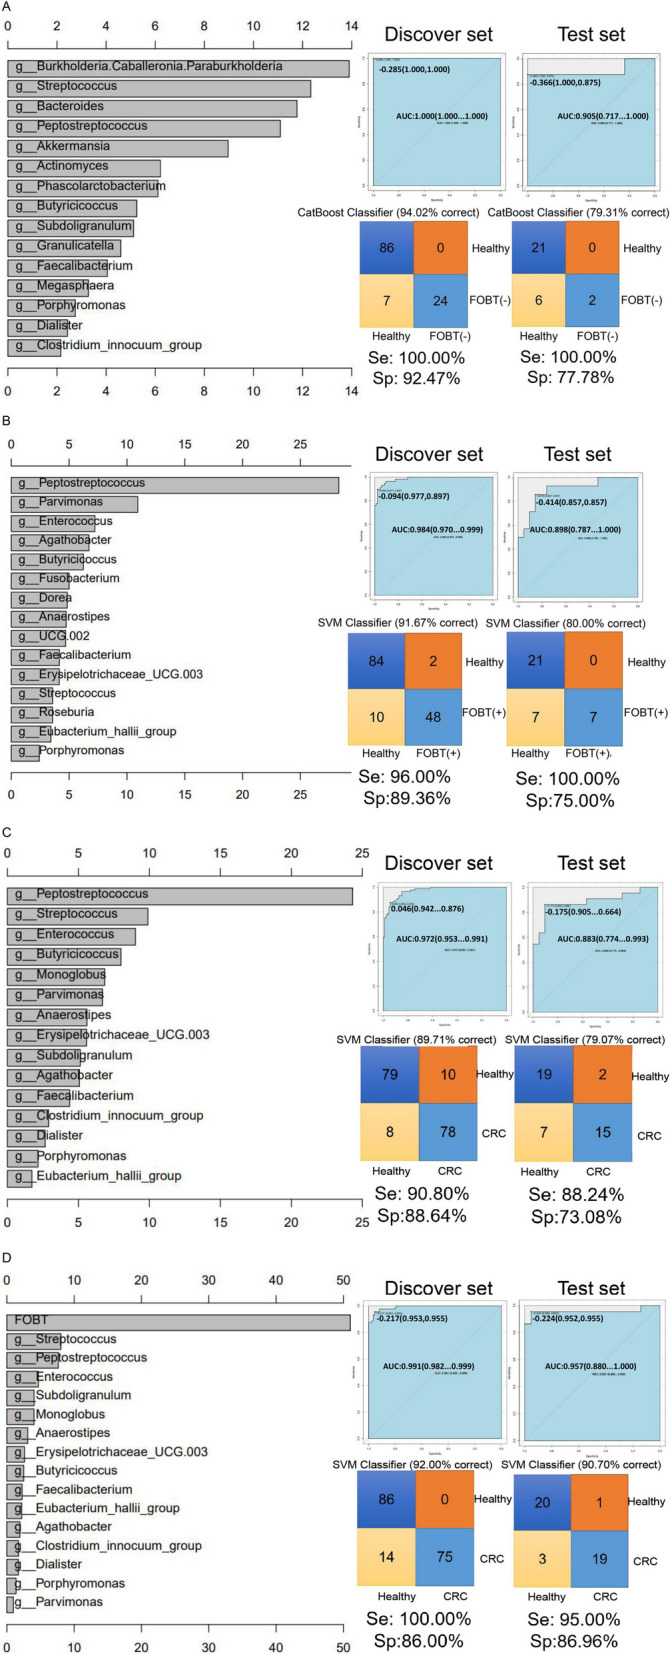
Results: The gut microbiota of healthy people and CRC patients with different fecal occult blood were mapped. There was no statistical difference in diversity between CRC patients with negative FOBT and positive FOBT. Bacteroides, Blautia and Escherichia-Shigella were more correlated to healthy individuals, while Streptococcus showed higher correlation with CRC patients with negative FOBT. The accuracy of CRC risk prediction model based on the support vector machines (SVM) algorithm was the highest (89.71%). Subsequently, FOBT was included as a characteristic element in the model construction, and the prediction accuracy of the model was all increased. Similarly, the CRC risk prediction model based on SVM algorithm had the highest accuracy (92%).

Conclusion: FOB affects the community composition of gut microbes. When predicting CRC risk based on gut microbiome, considering the influence of FOBT is expected to improve the accuracy of CRC risk prediction.

Keywords: 16S ribosomal RNA sequencing; Artificial intelligence; Colorectal cancer; Fecal occult blood test; Gut microbes; Risk prediction.


Conflict of interest statement

Declarations. Ethics approval and consent to participate: The clinical protocols involving the patients and the informed consent form were approved by the Chinese Clinical Trial Registry ( http://www.chictr.org.cn , ChiCTR1800018908) and Ethics Committee of Huzhou Central Hospital (No.202202005-01). All participants provided written informed consent. All methods were performed in accordance with the relevant guidelines and regulations in ethics approval and consent to participate. Consent for publication: Not applicable. Competing interests: The authors declare no competing interests.

Figures

Fig. 1
Fig. 1
The study flow chart. Fecal samples from healthy people, whose FOBT was negative, and CRC patients with FOBT positive and negative were collected for 16S ribosomal RNA sequencing. Subsequent statistical analysis including descriptive, diversity, differential and correlation analyses were performed after comparing all samples into four groups: healthy people VS CRC patients, healthy people VS CRC patients with negative FOBT, healthy people VS CRC patients with positive FOBT, and CRC patients with positive FOBT VS CRC patients with negative FOBT. Finally, predictive models for CRC were established based on the differential bacteria and FOBT
Fig. 2
Fig. 2
Alpha diversity analysis. A series of statistical indices, including Chao and ACE indices for community richness, and shannon and simpson indices for community diversity, were used to estimate alpha diversity. A shows the diversity of the gut bacteria between healthy individuals and CRC patients. B shows the diversity of the gut bacteria between healthy individuals and CRC patients with negative FOBT. C shows shows the diversity of the gut bacteria between healthy individuals and CRC patients with positive FOBT. D shows the diversity of the gut bacteria between CRC patients with negative FOBT and positive FOBT. * represents a significant difference between the two groups (0.01 < P< 0.05). ** represents a significant difference between the two groups (0.001 < P≤0.01). ***represents a significant difference between the two groups (P≤0.001)
Fig. 3
Fig. 3
Bacterial community structure analysis. Bacterial community structure were analyzed. A histogram of percentage accumulation drawn for the top 20 bacteria with the highest abundance in the two groups. A shows the bacterial community structure of the gut bacteria between healthy individuals and CRC patients. B shows the bacteria community structure of the gut bacteria between healthy individuals and CRC patients with negative FOBT. C shows the bacterial community structure of the gut bacteria between healthy individuals and CRC patients with positive FOBT. D shows the bacterial community structure of the gut bacteria between CRC patients with positive FOBT and CRC patients with negative FOBT
Fig. 4
Fig. 4
Differential microbial analysis. A: LDA was used to draw the histogram of LDA discriminant, and the microbial groups with significant effects in both groups were counted. The LDA score was obtained by linear regression analysis. The larger the LDA score, the greater the impact of bacterial abundance on the difference effect. A shows the differences of gut bacteria of the gut bacterial between healthy individuals and CRC patients. B shows the differences of gut bacteria between healthy individuals and CRC patients with negative FOBT. C shows the differences of gut bacteria between healthy individuals and CRC patients with positive FOBT. D shows the differences of gut bacteria between CRC patients with positive FOBT and CRC patients with negative FOBT
Fig. 5
Fig. 5
Correlation analysis. Pearson correlation coefficient was applied to measure the correlation of differential bacteria. Correlation between groups are presented by chord charts, with longer chord lengths indicating stronger correlations. Correlations within groups are presented by heatmaps. Red represents positive correlation, blue represents negative correlation, and the depth of the color shows the strength of the correlation. The Pearson correlation coefficient ranges from -1 to 1, where -1 indicates a completely negative correlation, 1 indicates a completely positive correlation, and 0 indicates no correlation. “*” represents a significant statistical significance (0.01 < P value < 0.05). “**” represents 0.001 < P value ≤0.01 and “***” represents P value ≤0.001. A shows chord diagram between healthy individuals and CRC patients with negative FOBT. B shows heatmap of the CRC patients with negative FOBT. C shows chord diagram between healthy individuals and CRC patients with positive FOBT. D shows the heatmap of the CRC patients with positive FOBT. E shows chord diagram between healthy individuals and CRC patients. F, G show heatmaps of the healthy individuals and CRC patients respectively
Fig. 6
Fig. 6
Prediction models of CRC based on differential bacteria and FOBT. Several machine learning algorithms were used to construct prediction models. The ROC curve on the right shows the diagnostic performance of the prediction model. AUC represents the predictive ability of the model. The closer the AUC is to 1, the stronger the predictive ability of the model is. The bar graph on the left depicts the relative feature importance included in the constructed model. A, B show the prediction models constructed to identify FOBT-negative and FOBT-positive CRC patients based on the characteristic differential bacteria. C shows the CRC prediction model only based on differential bacteria. D shows the CRC prediction models built after including FOBT as an element of model construction

References

    1. Siegel RL, Miller KD, Fuchs HE, Jemal A. Cancer statistics, 2022. CA Cancer J Clin. 2022;72(1):7–33. 10.3322/caac.21708. - PubMed
    1. Song M, Garrett WS, Chan AT. Nutrients, foods, and colorectal cancer prevention. Gastroenterology. 2015;148(6):1244–e6016. 10.1053/j.gastro.2014.12.035. - PMC - PubMed
    1. Almeida A, Mitchell AL, Boland M, Forster SC, Gloor GB, Tarkowska A, et al. A new genomic blueprint of the human gut microbiota. Nature. 2019;568(7753):499–504. 10.1038/s41586-019-0965-1. - PMC - PubMed
    1. Sun J, Chang EB. Exploring gut microbes in human health and disease: pushing the envelope. Genes Dis. 2014;1(2):132–9. 10.1016/j.gendis.2014.08.001. - PMC - PubMed
    1. Fan X, Jin Y, Chen G, Ma X, Zhang L. Gut microbiota dysbiosis drives the development of Colorectal Cancer. Digestion. 2021;102(4):508–15. 10.1159/000508328. - PubMed

Substances

LinkOut - more resources