

Together throughout the year: seasonal patterns of bacterial and eukaryotic microbial communities in a macrotidal estuary
- PMID: 39833892
- PMCID: PMC11748528
- DOI: 10.1186/s40793-025-00664-y
Together throughout the year: seasonal patterns of bacterial and eukaryotic microbial communities in a macrotidal estuary
Abstract
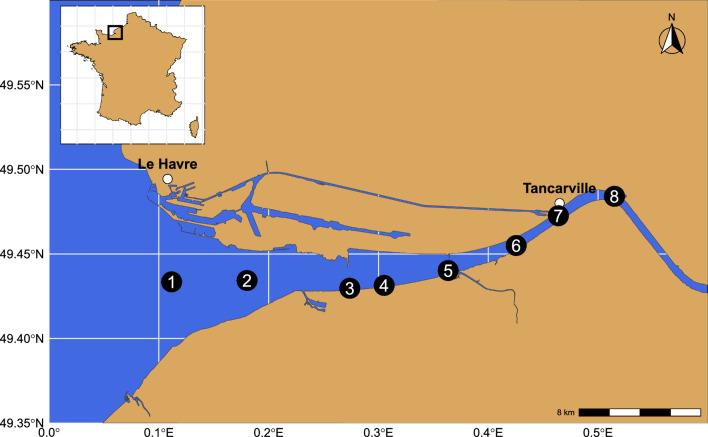
Background: Estuaries are complex ecosystems linking river and marine environments, where microorganisms play a key role in maintaining ecosystem functions. In the present study, we investigated monthly 8 sites at two depth layers and over a one-year period the bacterial and eukaryotic community dynamics along the Seine macrotidal estuary (Normandy, France). To date, the taxonomy of the microbial diversity present in this anthropized estuary remains elusive and the drivers of the microbial community structure are still unknown.
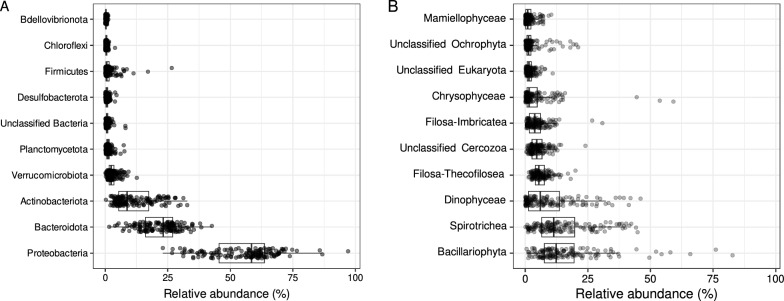
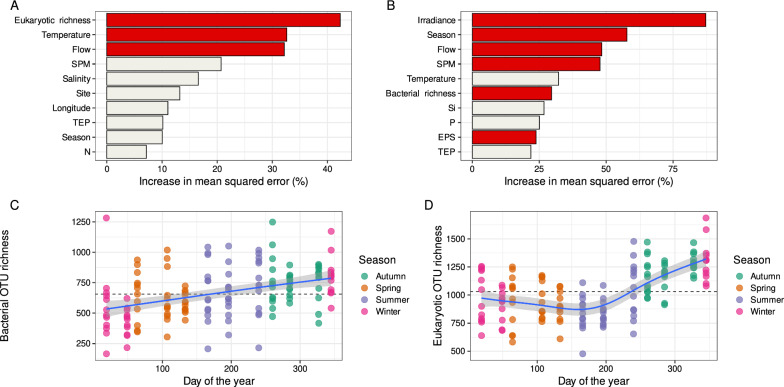
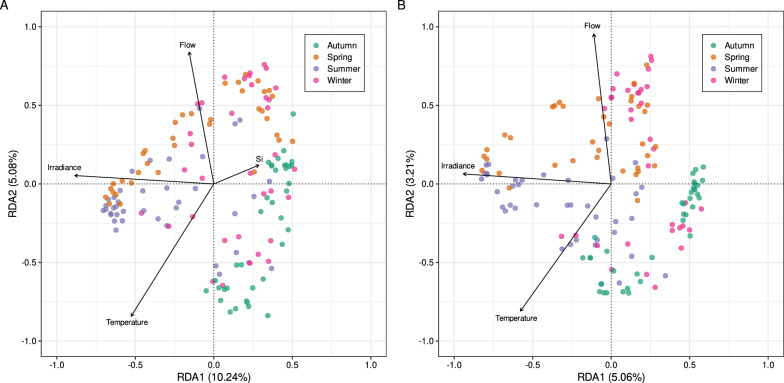
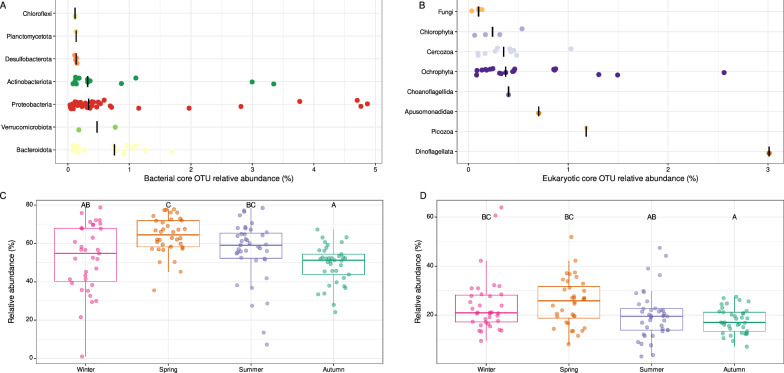
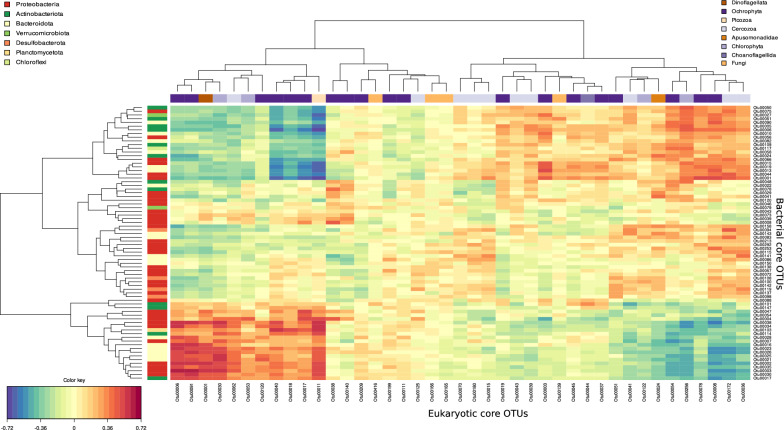
Results: The metabarcoding analysis of 147 samples revealed both a high bacterial and eukaryotic diversity, dominated by Proteobacteria, Bacteriodota, Actinobacteriota and Bacillariophyta, Spirotrichea, Dinophyceae, respectively. Along the estuary we only detected significant spatial patterns in the bacterial and eukaryotic community compositions for three and two months out of twelve, respectively. However, we found a clear seasonal effect on the diversity of both microbial communities driven by physical and chemical variables that were fluctuating over the year (temperature, irradiance, river flow). Biotic associations were also significant drivers of both alpha and beta diversity. Throughout the year, we identified a diverse and abundant core microbiota composed of 74 bacterial and 41 eukaryotic OTUs. These regionally abundant species include habitat generalists encompassing heterotrophs, phototrophs and consumers. Yet, many of these core OTUs remain taxonomically and functionally poorly assigned.
Conclusions: This molecular survey represents a milestone in the understanding of macrotidal estuary dynamics and the Seine ecosystem, through the identification of putative markers of ecosystem functioning. It also identifies seasons and biotic associations as main drivers of the Seine estuary microbiota and reveals the importance of a core microbiota throughout the year.
Keywords: Longitudinal gradient; Metabarcoding; Season; Seine River; Trophic interactions.
© 2025. The Author(s).
Conflict of interest statement
Declarations. Competing interests: The authors declare no competing interests.
Figures
References
-
- Cloern JE, Foster SQ, Kleckner AE. Phytoplankton primary production in the world’s estuarine-coastal ecosystems. Biogeosciences. 2014;11:2477–501. - DOI
-
- Regnier P, Arndt S, Goossens N, Volta C, Laruelle GG, Lauerwald R, et al. Modelling estuarine biogeochemical dynamics: From the local to the global scale. Aquat Geochem. 2013;19:591–626. - DOI
-
- Robins PE, Skov MW, Lewis MJ, Giménez L, Davies AG, Malham SK, et al. Impact of climate change on UK estuaries: a review of past trends and potential projections. Estuar Coast Shelf Sci. 2016;169:119–35. - DOI
-
- Boerema A, Meire P. Management for estuarine ecosystem services: a review. Ecol Eng. 2017;98:172–82. - DOI
Grants and funding
LinkOut - more resources
Full Text Sources