. 2025 Jan 20;20(1):8.
doi: 10.1186/s13024-025-00800-9.

Genetic context modulates aging and degeneration in the murine retina

Affiliations

Genetic context modulates aging and degeneration in the murine retina

Olivia J Marola et al. Mol Neurodegener. .

Abstract

Background: Age is the principal risk factor for neurodegeneration in both the retina and brain. The retina and brain share many biological properties; thus, insights into retinal aging and degeneration may shed light onto similar processes in the brain. Genetic makeup strongly influences susceptibility to age-related retinal disease. However, studies investigating retinal aging have not sufficiently accounted for genetic diversity. Therefore, examining molecular aging in the retina across different genetic backgrounds will enhance our understanding of human-relevant aging and degeneration in both the retina and brain-potentially improving therapeutic approaches to these debilitating conditions.

Methods: Transcriptomics and proteomics were employed to elucidate retinal aging signatures in nine genetically diverse mouse strains (C57BL/6J, 129S1/SvlmJ, NZO/HlLtJ, WSB/EiJ, CAST/EiJ, PWK/PhK, NOD/ShiLtJ, A/J, and BALB/cJ) across lifespan. These data predicted human disease-relevant changes in WSB and NZO strains. Accordingly, B6, WSB, and NZO mice were subjected to human-relevant in vivo examinations at 4, 8, 12, and/or 18M, including: slit lamp, fundus imaging, optical coherence tomography, fluorescein angiography, and pattern/full-field electroretinography. Retinal morphology, vascular structure, and cell counts were assessed ex vivo.

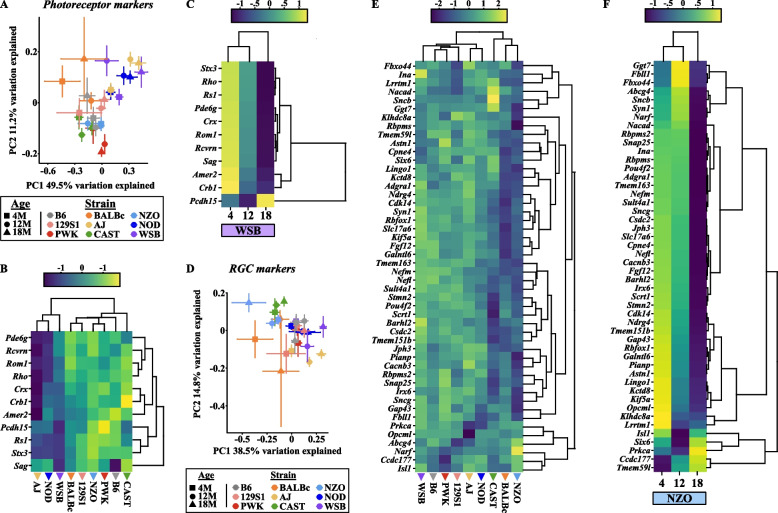
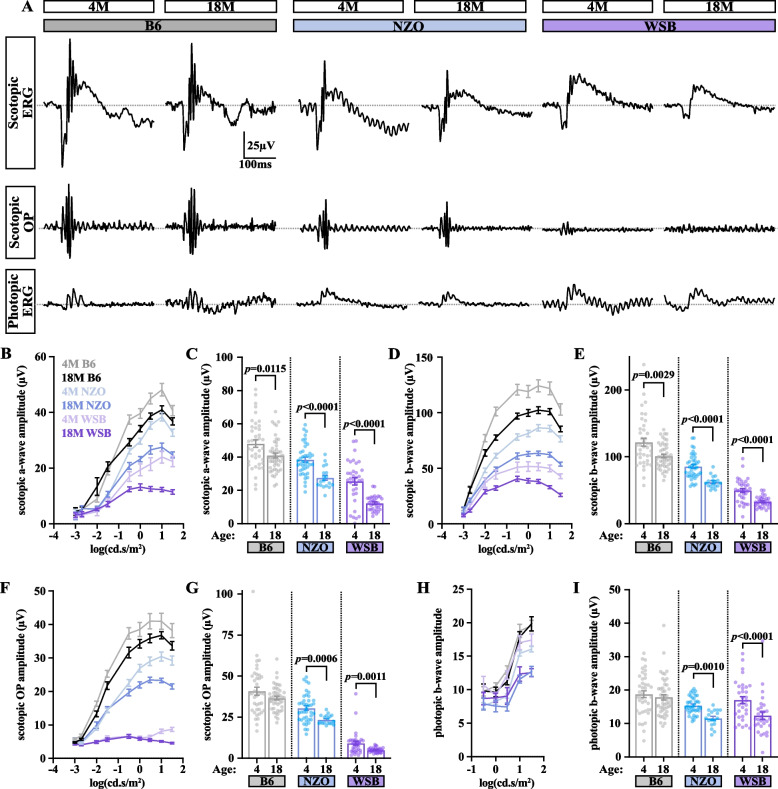
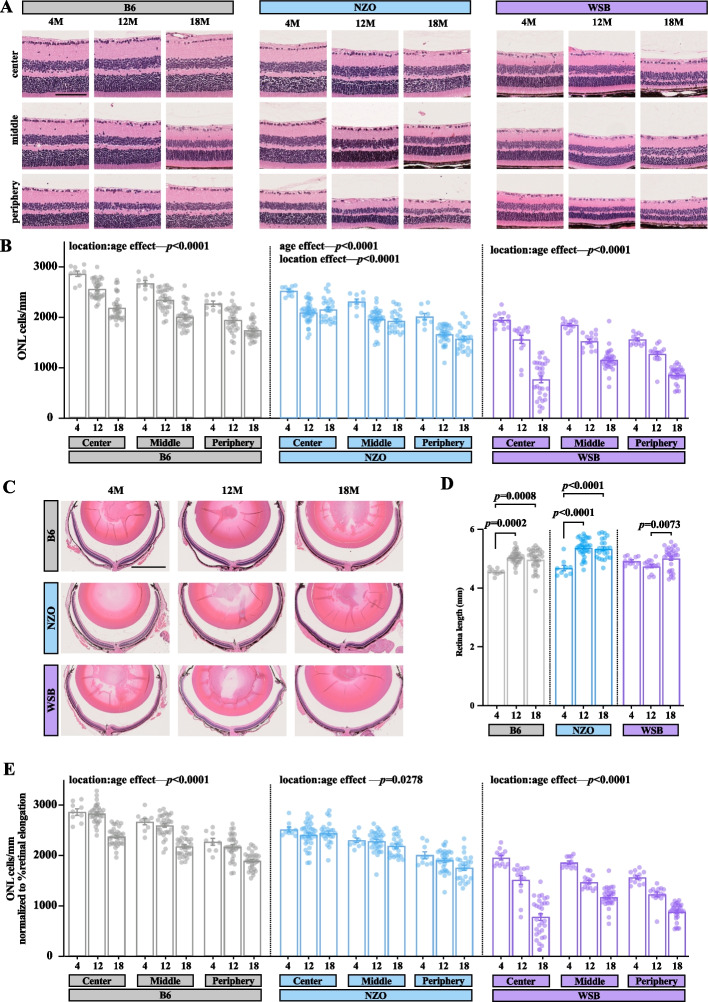
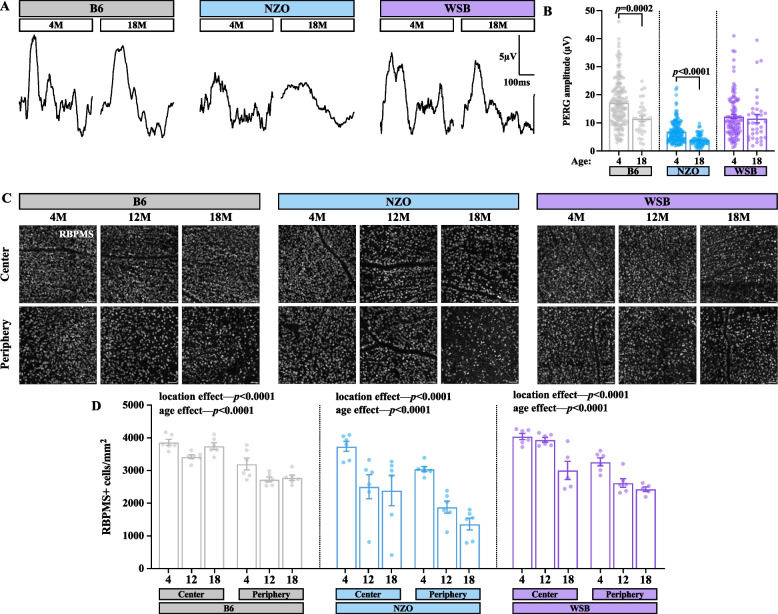
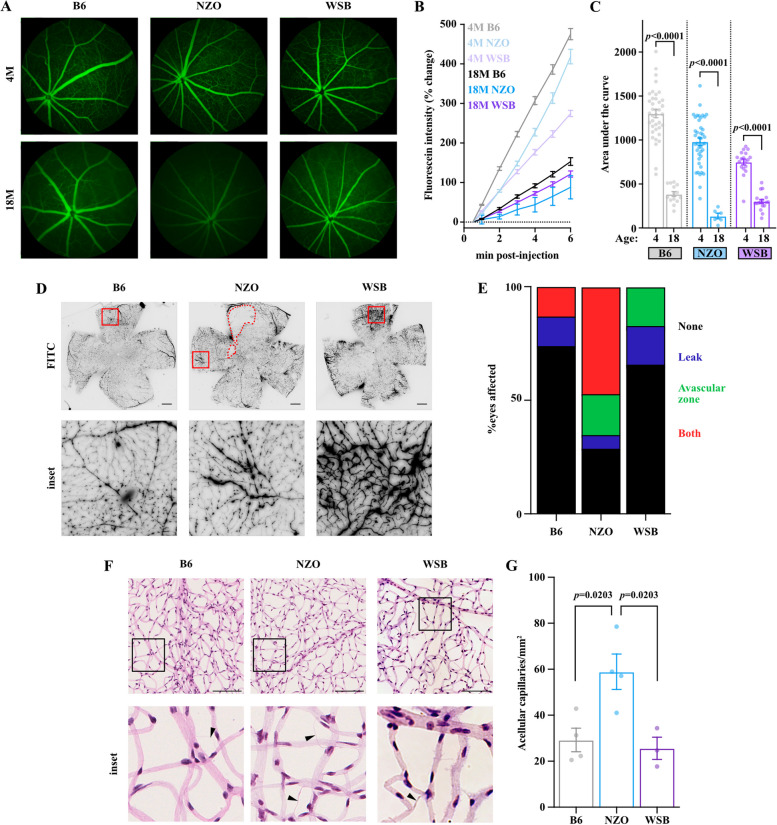
Results: We identified common molecular aging signatures across the nine mouse strains, which included genes associated with photoreceptor function and immune activation. Genetic background strongly modulated these aging signatures. Analysis of cell type-specific marker genes predicted age-related loss of photoreceptors and retinal ganglion cells (RGCs) in WSB and NZO, respectively. Fundus exams revealed retinitis pigmentosa-relevant pigmentary abnormalities in WSB retinas and diabetic retinopathy (DR)-relevant cotton wool spots and exudates in NZO retinas. Profound photoreceptor dysfunction and loss were confirmed in WSB. Molecular analyses indicated changes in photoreceptor-specific proteins prior to loss, suggesting photoreceptor-intrinsic dysfunction in WSB. In addition, age-associated RGC dysfunction, loss, and concomitant microvascular dysfunction were observed in NZO mice. Proteomic analyses revealed an early reduction in protective antioxidant processes, which may underlie increased susceptibility to DR-relevant pathology in NZO.

Conclusions: Genetic context is a strong determinant of retinal aging, and our multi-omics resource can aid in understanding age-related diseases of the eye and brain. Our investigations identified and validated WSB and NZO mice as improved preclinical models relevant to common retinal neurodegenerative diseases.

Keywords: Aging; Diabetic retinopathy; Genetic diversity; NZO; Proteomics; RNA-sequencing; Retina; Retinal vascular disease; Retinitis pigmentosa; WSB.


Conflict of interest statement

Declarations. Ethics approval and consent to participate: All research was approved by the Institutional Animal Care and Use Committee (IACUC) at The Jackson Laboratory. Consent for publication: Not applicable. Competing interests: The authors declare no competing interests.

Figures

Fig. 1
Fig. 1
Multi-omics profiling of the aging retina across genetically diverse mice. A Experimental design and schematic (created with BioRender.com). Principal component analysis (PCA) plots of B transcriptomic data and C proteomics data across all samples for PC1 and PC2. PCA plots and scatter plots visualizing changes in genes or proteins associated with the GO term: D “Regulation of complement”, including E CfhF “Detection of visible light”, including G Crb1, and H “Metabolic Process”, including I ACAT1. Scatter plots in E and G illustrate changes in the log(counts per million mapped reads (CPM) + 1) of Cfh and Crb1, and I illustrates the log(scaled peptide abundance) of ACAT1. In B, D-G: N = 8 (4F,4 M) NZO, 129S1, and B6 mice at each age; NOD mice: N = 8 (4F,4 M) at 4 M, N = 7 (3F,4 M) at 12 M, N = 6 (2F,4 M) at 18 M; AJ mice: N = 8 (4F,4 M) at 4 M and 12 M, N = 7 (4F,3 M) at 18 M; BALBc mice: N = 7 (3F,4 M) at 4 M and 12 M, N = 4F at 18 M; PWK mice: N = 8 (4F,4 M) at 4 M and 12 M, N = 3F at 18 M; CAST mice: N = 8 (4F,4 M) at 4 M and 12 M, N = 7 (3F,4 M) at 18 M; WSB mice: N = 7 (3F,4 M) at 4 M, N = 8 (4F,4 M) at 12 M and 18 M. In C, H, I: N = 8 (4F,4 M) NZO, 129S1, and CAST mice at each age; NOD mice: N = 7 (4F,3 M) at 4 M, N = 8 (4F,4 M) at 12 M, N = 6 (2F,4 M) at 18 M; AJ mice: N = 8 (4F,4 M) at 4 M and 12 M, N = 7 (4F,3 M) at 18 M; BALBc mice: N = 7 (3F,4 M) at 4 M, N = 8 (4F,4 M) at 12 M, N = 4F at 18 M; PWK mice: N = 8 (4F,4 M) at 4 M and 12 M, N = 3F at 18 M; B6 mice: N = 8 (4F,4 M) at 4 M and 18 M, N = 7 (3F,4 M) at 12 M; WSB mice: N = 7 (3F,4 M) at 4 M, N = 7 (4F,3 M) at 12 M, N = 8 (4F,4 M) at 18 M. In B-I: error bars represent SEM
Fig. 2
Fig. 2
Multi-omics profiling of the aging retina across genetically diverse mice reveals common molecular aging signatures. Volcano plots of differentially expressed A genes (DEGs) and B proteins (DEPs) associated with the common retinal aging signature across strains. Genes and Proteins with FDR < 0.05 are colored red. C Venn diagram illustrating the overlap of DEGs and DEPs associated with the common aging signature across strains. Enrichment GO term plots of common aging signature D DEGs and E DEPs. Yellow boxes highlight a general theme of adjacent GO terms. In AD: N = 8 (4F,4 M) NZO, 129S1, and B6 mice at each age; NOD mice: N = 8 (4F,4 M) at 4 M, N = 7 (3F,4 M) at 12 M, N = 6 (2F,4 M) at 18 M; AJ mice: N = 8 (4F,4 M) at 4 M and 12 M, N = 7 (4F,3 M) at 18 M; BALBc mice: N = 7 (3F,4 M) at 4 M and 12 M, N = 4F at 18 M; PWK mice: N = 8 (4F,4 M) at 4 M and 12 M, N = 3F at 18 M; CAST mice: N = 8 (4F,4 M) at 4 M and 12 M, N = 7 (3F,4 M) at 18 M; WSB mice: N = 7 (3F,4 M) at 4 M, N = 8 (4F,4 M) at 12 M and 18 M. In B, E: N = 8 (4F,4 M) NZO, 129S1, and CAST mice at each age; NOD mice: N = 7 (4F,3 M) at 4 M, N = 8 (4F,4 M) at 12 M, N = 6 (2F,4 M) at 18 M; AJ mice: N = 8 (4F,4 M) at 4 M and 12 M, N = 7 (4F,3 M) at 18 M; BALBc mice: N = 7 (3F,4 M) at 4 M, N = 8 (4F,4 M) at 12 M, N = 4F at 18 M; PWK mice: N = 8 (4F,4 M) at 4 M and 12 M, N = 3F at 18 M; B6 mice: N = 8 (4F,4 M) at 4 M and 18 M, N = 7 (3F,4 M) at 12 M; WSB mice: N = 7 (3F,4 M) at 4 M, N = 7 (4F,3 M) at 12 M, N = 8 (4F,4 M) at 18 M
Fig. 3
Fig. 3
Genetic context influences expression of proteins and genes associated with aging. Principal component analysis (PCA) plots of the common aging signature across all strains and sexes identified in A transcriptomic data and proteomics data. PCA plots and scatter plots visualizing changes in aging signature enriched genes or proteins associated with the GO term: C “Regulation of histone methylation”, including D Mthfr, E “Antigen processing and peptide presentation”, including F B2m, and G “Retina homeostasis”, including H Rho. For DFH: Scatter plots illustrating changes in the log(counts per million mapped reads (CPM) + 1). In AC-H: N = 8 (4F,4 M) NZO, 129S1, and B6 mice at each age; NOD mice: N = 8 (4F,4 M) at 4 M, N = 7 (3F,4 M) at 12 M, N = 6 (2F,4 M) at 18 M; AJ mice: N = 8 (4F,4 M) at 4 M and 12 M, N = 7 (4F,3 M) at 18 M; BALBc mice: N = 7 (3F,4 M) at 4 M and 12 M, N = 4F at 18 M; PWK mice: N = 8 (4F,4 M) at 4 M and 12 M, N = 3F at 18 M; CAST mice: N = 8 (4F,4 M) at 4 M and 12 M, N = 7 (3F,4 M) at 18 M; WSB mice: N = 7 (3F,4 M) at 4 M, N = 8 (4F,4 M) at 12 M and 18 M. In B: N = 8 (4F,4 M) NZO, 129S1, and CAST mice at each age; NOD mice: N = 7 (4F,3 M) at 4 M, N = 8 (4F,4 M) at 12 M, N = 6 (2F,4 M) at 18 M; AJ mice: N = 8 (4F,4 M) at 4 M and 12 M, N = 7 (4F,3 M) at 18 M; BALBc mice: N = 7 (3F,4 M) at 4 M, N = 8 (4F,4 M) at 12 M, N = 4F at 18 M; PWK mice: N = 8 (4F,4 M) at 4 M and 12 M, N = 3F at 18 M; B6 mice: N = 8 (4F,4 M) at 4 M and 18 M, N = 7 (3F,4 M) at 12 M; WSB mice: N = 7 (3F,4 M) at 4 M, N = 7 (4F,3 M) at 12 M, N = 8 (4F,4 M) at 18 M. In A-H: error bars represent SEM
Fig. 4
Fig. 4
Photoreceptor and RGC markers change in strain-specific manners across aging. A Principal component analysis (PCA) plot of the expression of unique marker genes associated with photoreceptors across all strains. Heatmaps of marker genes associated with photoreceptors across all strains at 18 M B and across aging in C WSB mice. D PCA plot of the expression of unique marker genes associated with RGCs across all strains. Heatmaps of marker genes associated with RGCs across E all strains at 18 M and across aging in F NZO mice. In B, C, E, F: average expression for the entire group is shown. Scaled and centered expression of the library-size and log normalized average expression value for each gene in each group. In A, B, D, E: N = 8 (4F,4 M) NZO, 129S1, and B6 mice at each age; NOD mice: N = 8 (4F,4 M) at 4 M, N = 7 (3F,4 M) at 12 M, N = 6 (2F,4 M) at 18 M; AJ mice: N = 8 (4F,4 M) at 4 M and 12 M, N = 7 (4F,3 M) at 18 M; BALBc mice: N = 7 (3F,4 M) at 4 M and 12 M, N = 4F at 18 M; PWK mice: N = 8 (4F,4 M) at 4 M and 12 M, N = 3F at 18 M; CAST mice: N = 8 (4F,4 M) at 4 M and 12 M, N = 7 (3F,4 M) at 18 M; WSB mice: N = 7 (3F,4 M) at 4 M, N = 8 (4F,4 M) at 12 M and 18 M. In C: N = 7 (3F,4 M) WSB mice at 4 M, N = 8 (4F,4 M) WSB mice at 12 M and 18 M. In F: N = 8 (4F,4 M) NZO at each age. In A, D: error bars represent SEM
Fig. 5
Fig. 5
Validating omics analyses using in vivo characterization. A Experimental design schematic (created with BioRender.com). B Representative slit lamp images of 4 and 18 M B6, NZO and WSB mice. C Representative fundus images of B6, NZO and WSB retinas at the ages of 4, 12, and 18 M. Arrowheads indicate fundus spots. * indicates waxy optic disc pallor. Insets highlight different fundus abnormalities: B6 – fundus spot, NZO – exudates, WSB – pigmentary change. D Quantification of the proportion of eyes affected by fundus abnormalities at 4, 8, 12 and 18 M. In D: chi-square tests were used to test differences between ages within each strain: B6 – p < 0.0001; NZO – p < 0.0001; WSB – p = 0.0044. For B6: N = 156 eyes at 4 M, 64 eyes at 8 M, 63 eyes at 12 M, and 24 eyes at 18 M. For NZO: N = 160 eyes at 4 M, 70 eyes at 8 M, 64 eyes at 12 M, and 31 eyes at 18 M. For WSB: N = 36 eyes at 4 M, 42 eyes at 8 M, 60 eyes at 12 M, and 46 eyes at 18 M
Fig. 6
Fig. 6
Optical Coherence Tomography (OCT) reveals strain specific aging effects on retinal thinning. A Representative OCT images at 4, 8, 12 and 18 M of age in B6, NZO and WSB mice. NFL: nerve fiber layer, GCL: ganglion cell layer, IPL: inner plexiform layer, INL: inner nuclear layer, OPL: outer plexiform layer, ONL: outer nuclear layer, ELM: external limiting membrane, IS/OS: inner/outer segment, RPE: retinal pigment epithelium. Scale bar, 100 µm. Quantification of: B the total retina thickness (distance from top of NFL/GCL to bottom of the RPE) across strains and sexes and ages, C NFL/GCL/IPL complex thickness, D INL thickness, and E ONL thickness. In B-E: due to prominent differences in retinal organization by strain, two-way ANOVAs within each strain were utilized to evaluate the impact of aging and sex. For B6: N = 19 (10F,9 M) eyes at 4 M, 33 (22F,11 M) at 8 M, 51 (18F,33 M) at 12 M, 39 (16F,23 M) at 18 M; for WSB: N = 24 (17F,7 M) eyes at 4 M, 72 (34F,38 M) at 8 M, 77 (40F,36 M) at 12 M, 55 (33F,22 M) at 18 M; for NZO: N = 73 (40F,33 M) eyes at 4 M, 33 (17F,16 M) at 8 M, 24 (14F,10 M) at 12 M, 16 (5F,11 M) at 18 M. Error bars represent SEM
Fig. 7
Fig. 7
WSB mice exhibit enhanced aging-associated photoreceptor functional decline. A Representative scotopic and photopic ERG and OP curves at 10 cd.s/m2 luminance in B6, WSB and NZO mice. Quantification of scotopic B a-wave amplitude (µV), D b-wave amplitude (µV), and F OP amplitude (µV) across luminance intensities for 4 M and 18 M B6, NZO and WSB mice. Amplitudes at 10 cd.s/m2 luminance for 4 and 18 M B6, NZO, and WSB mice for the scotopic C a-waves, E b-waves, G OPs. H Quantification of photopic b-wave amplitude (µV) across luminance intensities for 4 M and 18 M B6, NZO and WSB mice. I Quantification of photopic b-wave amplitudes (µV) at 10 cd.s/m2 luminance for 4 and 18 M B6, NZO, and WSB mice. Error bars represent SEM. In A-G: for B6: N = 40 eyes at 4 M, 48 at 18 M; for WSB: N = 37 eyes at 4 M, 32 at 18 M; for NZO: N = 40 eyes at 4 M, 18 at 18 M. In H-I: for B6: N = 40 eyes at 4 M, 46 at 18 M; for WSB: N = 32 eyes at 4 M, 30 at 18 M; for NZO: N = 40 eyes at 4 M, 18 at 18 M. All comparisons were made within strains due to baseline differences. In C: for B6: Mann–Whitney U test; for NZO: Student’s t-test; for WSB: Welch’s t-test. In E: for B6: Mann–Whitney U test; for NZO and WSB: Welch’s t-test. In G: for all three strains: Mann–Whitney U test. In I: for B6 and NZO: Mann–Whitney U test; for WSB, Student’s t-test
Fig. 8
Fig. 8
Aging is associated with outer nuclear layer cell loss, which is exacerbated in WSB animals. A Representative hematoxylin and eosin (H&E) staining of retinas at three anatomical locations relative to the optic nerve head across B6, NZO, and WSB mice at 4, 12, and 18 M. Scale bar: 100 µm. B Automated cell counts within the outer nuclear layer (ONL). C Representative H&E staining of whole retinas across B6, NZO, and WSB mice at 4, 12, and 18 M. Scale bar: 1 mm. D Automated retinal length measurement (mm) across strains and ages. E Automated cell counts within the outer nuclear layer (ONL) from B normalized to % change in retina length from respective mean 4 M baseline in D. In B and E: mixed effects analyses with repeated measures were used to assess regional and aging effects within strains. In D, B6 and WSB data were analyzed with Kruskal–Wallis tests and posthoc Dunn’s multiple comparison test. NZO data were analyzed with a one-way ANOVA and posthoc Tukey’s multiple comparison test. Error bars represent SEM. In B, D, E at 4, 12, and 18 M respectively: B6: N = 9, 31, 32; NZO: N = 9, 35, 24; WSB: N = 12, 14, 30
Fig. 9
Fig. 9
NZO mice exhibit reduced gross RGC potentials and RGC loss with age. A Representative PERG response curves from B6, WSB and NZO mice at 4 and 18 M. B Amplitude of PERG response (µv) in 4 M and 18 M B6, WSB and NZO mice. C Representative images of RBMPS immunohistochemistry in B6, NZO, and WSB mice at 4, 12, and 18 M. Scale bar:50 µm. D. Quantification of automated RBPMS + retinal ganglion cells (RGCs) counts per mm2 in the central retina and peripheral retina. In A-B: for B6: N = 152 eyes at 4 M, 34 at 18 M; for WSB: N = 101 eyes at 4 M, 34 at 18 M; for NZO: N = 142 eyes at 4 M, 66 at 18 M. In C-D: for B6 and NZO: N = 6 eyes at 4, 12 and 18 M; for WSB: N = 6 eyes at 4 and 12 M, 5 at 18 M. In B: Mann–Whitney U tests were used to evaluate differences between ages within strains. In D: two-way ANOVAs were used to assess effects of region and age within strains. Error bars represent SEM
Fig. 10
Fig. 10
NZO mice exhibit microvascular dysfunction and capillary loss. A Representative images of fluorescein angiography at 6 min post administration in B6, NZO, and WSB mice at 4 and 18 M. B Quantification of change in fluorescent intensity of fluorescein from initial measurement across groups. C Quantification of the area under the curve from B for B6, NZO, and WSB mice at 4 and 18 M. D. Representative images of 70 kDa FITC-Dextran leakage assay within 12 M B6, NZO and WSB mice. Insets highlight notable findings. Scale bar, 100 µm. E Quantification of presence of vascular abnormalities in B6, NZO, and WSB mice. Chi-square test: p < 0.0001. F Representative images of retinal vascular networks stained with H&E in 12 M B6, NZO and WSB mice. Insets highlight areas with acellular capillaries (arrowheads). Scale bar: 100 µm. G Quantification of acellular capillaries per mm2 in 12 M B6, NZO and WSB mice. In A-C: for B6: N = 38 eyes at 4 M, 32 eyes at 8 M, 30 at 12 M, 14 at 18 M; for WSB: N = 18 eyes at 4 M, 22 at 8 M, 19 at 12 M, 17 at 18 M; for NZO: N = 42 eyes at 4 M, 35 at 8 M, 30 at 12 M, 6 at 18 M. For D-E: N = 8 B6, 17 NZO and 6 WSB eyes. For F-G: N = 4 B6, 4 NZO and 3 WSB eyes. In C: for B6 and NZO: Welch’s t-test; for WSB: Mann–Whitney U test. In G: one-way ANOVA (p = 0.0101) with Tukey’s multiple comparison test. Error bars represent SEM

Update of

References

    1. Marques AP, Ramke J, Cairns J, Butt T, Zhang JH, Jones I, et al. The economics of vision impairment and its leading causes: A systematic review. EClinicalMedicine. 2022;46: 101354. - PMC - PubMed
    1. Sabeti F, Lane J, Rohan EMF, Essex RW, McKone E, Maddess T. Relationships between retinal structure and function and vision-related quality of life measures in advanced age-related macular degeneration. Graefes Arch Clin Exp Ophthalmol. 2021;259(12):3687–96. - PubMed
    1. Wolfram C, Lorenz K, Breitscheidel L, Verboven Y, Pfeiffer N. Health- and vision-related quality of life in patients with ocular hypertension or primary open-angle glaucoma. Ophthalmologica. 2013;229(4):227–34. - PubMed
    1. Assi L, Chamseddine F, Ibrahim P, Sabbagh H, Rosman L, Congdon N, et al. A Global Assessment of Eye Health and Quality of Life: A Systematic Review of Systematic Reviews. JAMA Ophthalmol. 2021;139(5):526–41. - PMC - PubMed
    1. Organization WH. World report on vision. 2019.