. 2025 Jan 20;22(1):11.
doi: 10.1186/s12974-025-03333-6.

Microglial double stranded DNA accumulation induced by DNase II deficiency drives neuroinflammation and neurodegeneration

Affiliations

Microglial double stranded DNA accumulation induced by DNase II deficiency drives neuroinflammation and neurodegeneration

Ling-Jie Li et al. J Neuroinflammation. .

Abstract

Background: Deoxyribonuclease 2 (DNase II) is pivotal in the clearance of cytoplasmic double stranded DNA (dsDNA). Its deficiency incurs DNA accumulation in cytoplasm, which is a hallmark of multiple neurodegenerative diseases. Our previous study showed that neuronal DNase II deficiency drove tau hyperphosphorylation and neurodegeneration (Li et al., Transl Neurodegener 13:39, 2024). Although it has been verified that DNase II participates in type I interferons (IFN-I) mediated autoinflammation and senescence in peripheral systems, the role of microglial DNase II in neuroinflammation and neurodegenerative diseases such as Alzheimer's disease (AD) is still unknown.

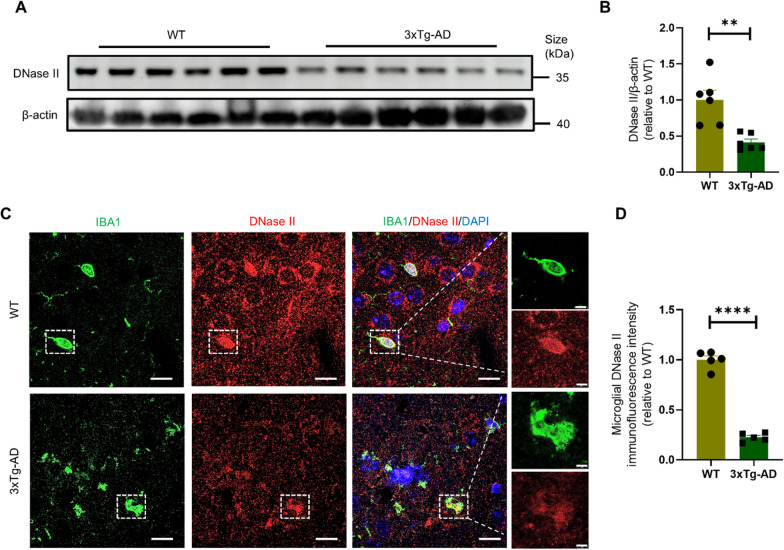
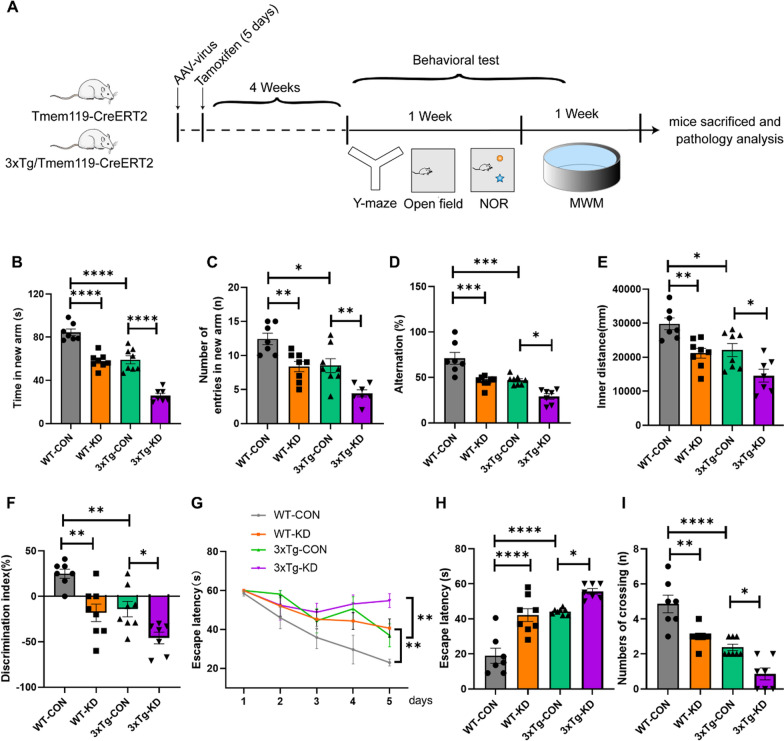
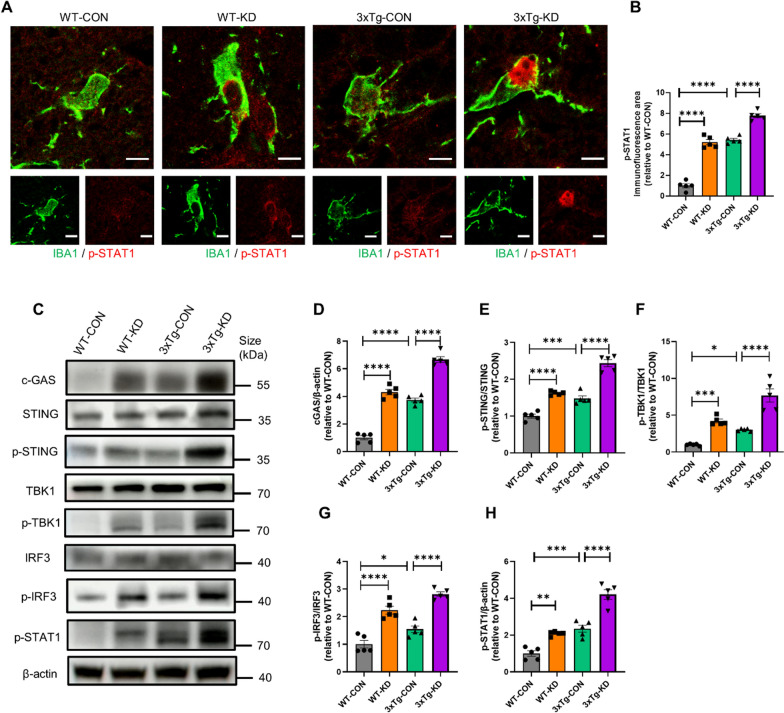
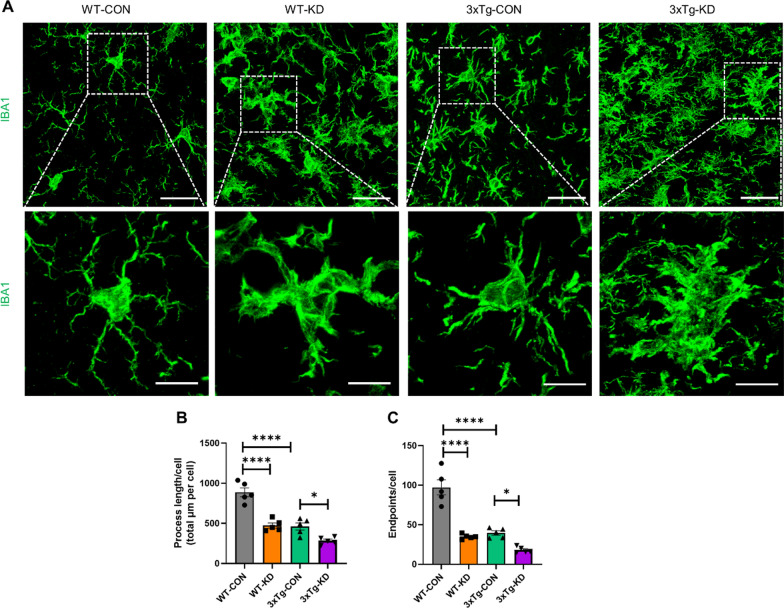
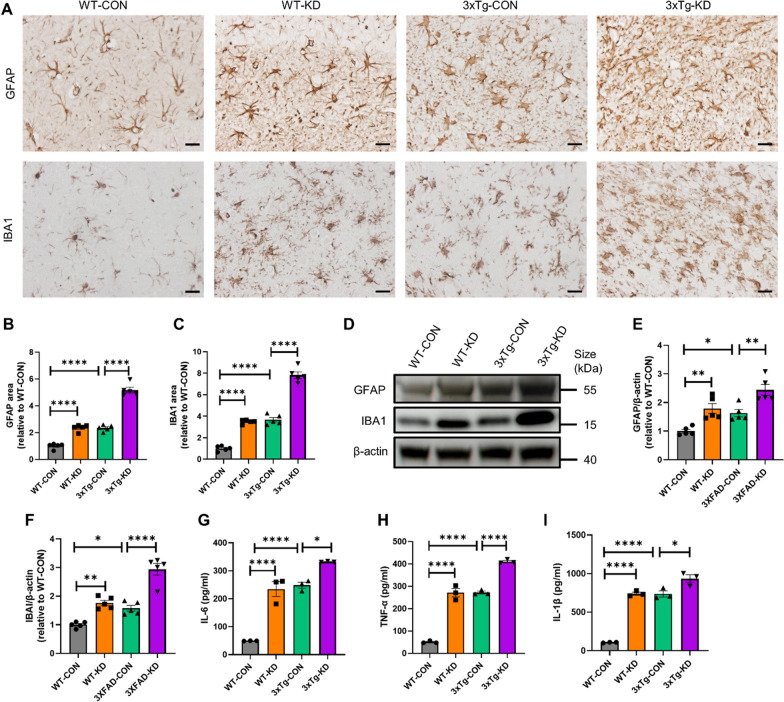
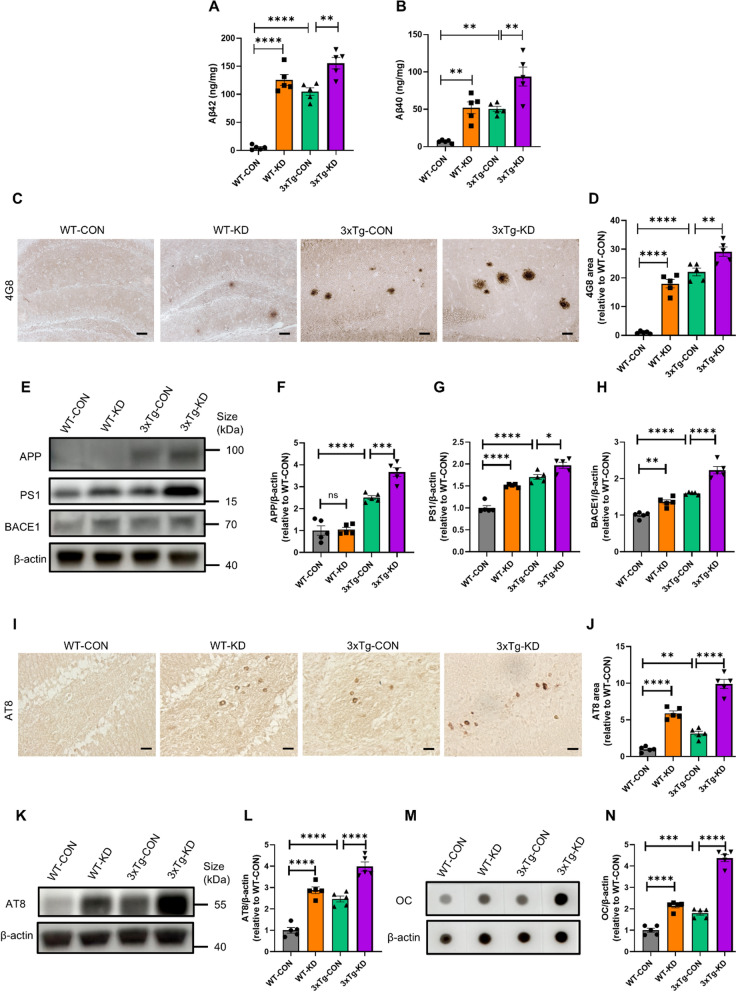
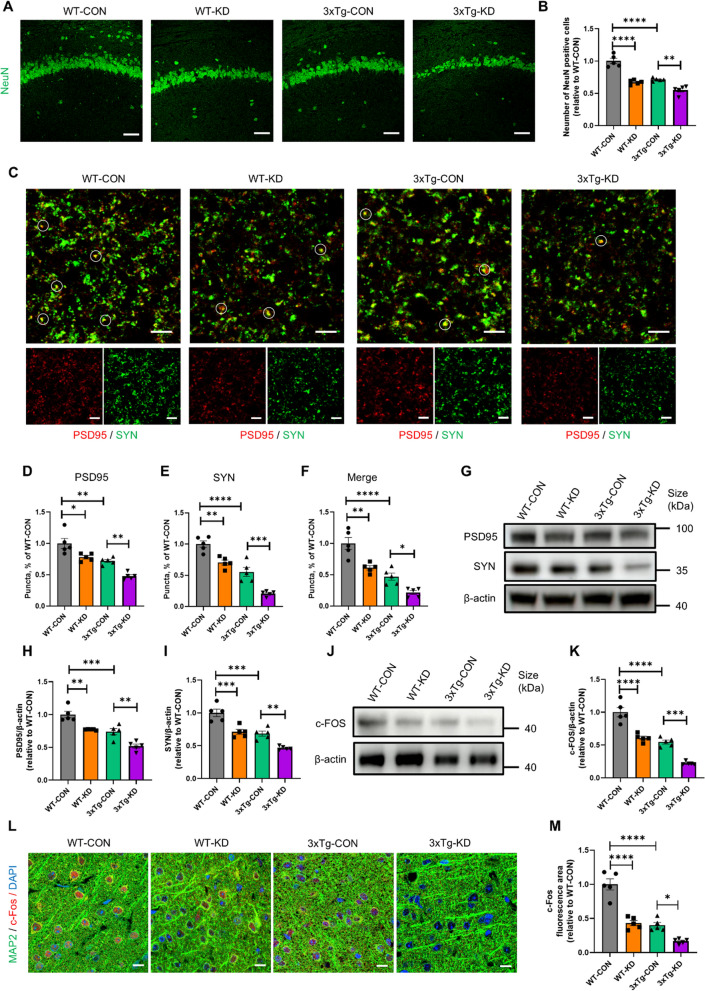
Methods: The levels of microglial DNase II in triple transgenic AD mice (3xTg-AD) were measured by immunohistochemistry. The cognitive performance of microglial DNase II deficient WT and AD mice was determined using the Morris water maze test, Y-maze test, novel object recognition test and open filed test. To investigate the impact of microglial DNase II deficiency on microglial morphology, cyclic GMP-AMP synthase (cGAS)-stimulator of interferon genes (STING) pathway and IFN-I pathway, neuroinflammation, synapses loss, amyloid pathology and tauopathy, the levels of cGAS-STING and IFN-I pathway related protein, gliosis and proinflammatory cytokines, synaptic protein, complement protein, Aβ levels, phosphorylated tau in the brains of the microglial DNase II deficient WT and AD mice were evaluated by immunolabeling, immunoblotting, q-PCR or ELISA.

Results: We found that the levels of DNase II were significantly decreased in the microglia of 3xTg-AD mice. Microglial DNase II deficiency altered microglial morphology and transcriptional signatures, activated the cGAS-STING and IFN-I pathway, initiated neuroinflammation, led to synapse loss via complement-dependent pathway, increased Aβ levels and tauopathy, and induced cognitive decline.

Conclusions: Our study shows the effect of microglial DNase II deficiency and cytoplasmic accumulated dsDNA on neuroinflammation, and reveals the initiatory mechanism of AD pathology, suggesting that DNase II is a potential target for neurodegenerative diseases.

Keywords: Alzheimer's disease (AD); DNase II; Double stranded DNA (dsDNA); Neuroinflammation; Type I interferons pathway; cGAS-STING pathway.


Conflict of interest statement

Declarations. Ethics approval and consent to participate: All animal experiments were performed in accordance with the China Public Health Service Guide for the Care and Use of Laboratory Animals. Experiments involving mice and protocols were approved by the Institutional Animal Care and Use Committee of Tsinghua University. Authors are responsible for correctness of the statements provided in the manuscript. Consent for publication: All authors have reviewed the final manuscript and consent to publication. Competing interests: The authors declare no competing interests.

Figures

Fig. 1
Fig. 1
The levels of microglial DNase II are decreased in the brains of AD model mice. A Western blots analysis of DNase II in the hippocampus lysates of 6-month-old WT mice and 3xTg-AD mice. B Quantitation of the levels of DNase II in (A). n = 6 mice per group. C Representative images of DNase II (red) and IBA1 (green) fluorescence staining in the hippocampus of 6-month-old WT mice and 3xTg-AD mice. Scale bars, 25 μm (left) and 5 μm (right). D Quantification of DNase II immunofluorescence intensity in (C). n = 5 mice per group. Data are mean ± SEM, and an unpaired t test with two-tailed was used for statistical analysis. *P < 0.05, **P < 0.01, ***P < 0.001, ****P < 0.0001, ns, not significant
Fig. 2
Fig. 2
Microglial DNase II deficiency induces cognitive impairment in WT and AD mice. A Schematic representation of the pharmacological treatment and experimental measurement. B, C The time spent (B) and number of entries (C) in the novel arm of mice in forced Y-maze. D The alternation of mice in a spontaneous Y-maze. E The distance traveled of mice in the central area of the open field. F Discrimination index of the mice in novel object recognition test. G The latency to find the hidden platform during training trials. n = 7–8 mice per group. Data are mean ± SEM, and a two-way ANOVA followed by Tukey’s multiple comparison test was used for statistical analysis. H The latency to the position of the removed platform during probe trials. I The number of platform crossings during probe trials. For (B, D–F, H), n = 7–8 mice per group, data are mean ± SEM, and a one-way ANOVA followed by Tukey’s multiple comparison test was used for statistical analysis. For (C, I), n = 7–8 mice per group, data are mean ± SEM, and Kruskal–Wallis one-way ANOVA with two-stage step-up method Benjamini, Krieger, and Yekutieli test was used for statistical analysis. *P < 0.05, **P < 0.01, ***P < 0.001, ****P < 0.0001, ns, not significant
Fig. 3
Fig. 3
Microglial DNase II deficiency induces cGAS-STING and I-IFN pathway activation in WT and AD mice. A Representative images of p-STAT1 (red) and IBA1 (green) fluorescence staining in the hippocampus of WT mice and AD mice. Scale bars, 5 μm. B Quantification of p-STAT1 fluorescent area in (A). n = 5 mice per group. C Western blots analysis of cGAS, STING, p-STING, TBK1, p-TBK1, IRF3, p-IRF3 and p-STAT1 in the hippocampus lysates of WT mice and AD mice. D–H Quantitation of the levels of cGAS (D), p-STING/STING (E), p-TBK1/TBK1 (F), p-IRF3/IRF3 (G), p-STAT1 (H) in (C). For (D–H), n = 5 mice per group, data are mean ± SEM, and a one-way ANOVA followed by Tukey’s multiple comparison test was used for statistical analysis. *P < 0.05, **P < 0.01, ***P < 0.001, ****P < 0.0001, ns, not significant
Fig. 4
Fig. 4
Microglial DNase II deficiency induces alternation of microglia morphology. A Representative images of IBA1 (green)-stained microglial in the brains of WT mice and AD mice. Scale bars, 25 μm (up) and 10 μm (down). B Quantification of microglial process length. n = 5 mice per group. C Quantification of microglial endpoints. n = 5 mice per group. For (B, C), data are mean ± SEM, and a one-way ANOVA followed by Tukey’s multiple comparison test was used for statistical analysis. *P < 0.05, **P < 0.01, ***P < 0.001, ****P < 0.0001, ns, not significant
Fig. 5
Fig. 5
Microglial DNase II deficiency induces neuroinflammation in WT and AD mice. A Detection of astrocytes and microglia by immunolabeling GFAP and IBA1 in the hippocampus of WT mice and AD mice. Scale bars, 20 μm. B Quantification of GFAP-labeled area in (A). n = 5 mice per group. C Quantification of IBA1-labeled area in (A). n = 5 mice per group. D Western blots analysis of GFAP and IBA1 in the hippocampus lysates of WT mice and AD mice. E Quantitation of the levels of GFAP in (D). n = 5 mice per group. F Quantitation of the levels of IBA1 in (D). n = 5 mice per group. G–I The levels of inflammatory cytokines IL-6 (G), TNF-α (H) and IL-1β (I) in the hippocampus lysates of mice were measured by ELISA. For (G–I), data are pooled from three independent experiments. For (B, C, E–I), data are mean ± SEM, and a one-way ANOVA followed by Tukey’s multiple comparison test was used for statistical analysis. *P < 0.05, **P < 0.01, ***P < 0.001, ****P < 0.0001, ns, not significant
Fig. 6
Fig. 6
Microglial DNase II deficiency induces Aβ plaques and tau phosphorylation in WT and AD mice. A, B MSD analysis of Aβ42 (A) and Aβ40 (B) in the insoluble hippocampus lysates of WT mice and AD mice. n = 5 mice per group. C Representative images of 4G8+ Aβ plaques in hippocampus of WT mice and AD mice. Scale bars, 10 μm. D The area of 4G8+ Aβ plaque in hippocampus of mouse brains was quantified using ImageJ software. n = 5 mice per group. E Western blots analysis of APP, PS1 and BACE1 in the hippocampus lysates of WT mice and AD mice. F–H Quantitation of the levels of APP (F), PS1 (G) and BACE1 (H) in (E). n = 5 mice per group. I Detection of phosphorylated tau by immunolabeling AT8 in the hippocampal region of WT mice and AD mice. Scale bars, 10 μm. J Quantification of AT8-labeled area in (I). n = 5 mice per group. K Western blots analysis of AT8 in the hippocampus lysates of WT mice and AD mice. L Quantitation of the levels of AT8 in (K). n = 5 mice per group. M Dot-blot analysis of OC-positive fibrillar in the hippocampus lysates of WT mice and AD mice. N Quantification of OC-positive fibrillar in (M). n = 5 mice per group. For (A, B, D, F–H, J, L, N), data are mean ± SEM, and a one-way ANOVA followed by Tukey’s multiple comparison test was used for statistical analysis. *P < 0.05, **P < 0.01, ***P < 0.001, ****P < 0.0001, ns, not significant
Fig. 7
Fig. 7
Microglial DNase II deficiency induces synapses loss in WT and AD mice. A Immunolabeling of NeuN (green) in the brains of WT mice and AD mice. Scale bars, 5 μm. B Quantification number of NeuN positive cells in (A). n = 5 mice per group. C Immunolabeling of PSD95 (red) and synaptophysin (SYN) (green) puncta in the brains of WT mice and AD mice. Co-localized PSD95 and SYN puncta are indicated by circles. Scale bars, 5 μm. D Quantification of PSD95 puncta in (C). n = 5 mice per group. E Quantification of SYN puncta in (C). n = 5 mice per group. F Quantification of co-localized PSD95 and SYN puncta in (C). n = 5 mice per group. G Western blots analysis of PSD95 and SYN in the hippocampal homogenates of WT mice and AD mice. H Quantitation of the levels of PSD95 in the brains of mice in (G). n = 5 mice per group. I Quantitation of the levels of SYN in the brains of mice in (G). n = 5 mice per group. J Western blots analysis of c-FOS in the hippocampal homogenates of WT mice and AD mice. K Quantitation of the levels of c-FOS in the hippocampal homogenates of mice in (J). n = 5 mice per group. L Representative images of c-Fos (red) and DAPI (blue) fluorescence staining in the MAP2+ (green) neurons of WT mice and AD mice. Scale bars, 10 μm. M Quantification of c-Fos fluorescent area in (L). n = 5 mice per group. For (B, D–F, H–I, K, M), data are mean ± SEM, and a one-way ANOVA followed by Tukey’s multiple comparison test was used for statistical analysis. *P < 0.05, **P < 0.01, ***P < 0.001, ****P < 0.0001, ns, not significant
Fig. 8
Fig. 8
Microglial DNase II deficiency actives complement pathway and induces engulfment of synapses. A Western blots analysis of C1q and C3 in the hippocampal homogenates of WT mice and AD mice. B Quantitation of the levels of C1q in the hippocampal homogenates of mice in (A). n = 5 mice per group. C Quantitation of the levels of C3 in the hippocampal homogenates of mice in (A). n = 5 mice per group. D Representative images of C3 (green) and GFAP (red) fluorescence staining in the hippocampus of WT mice and AD mice. Scale bars, 10 μm. E Quantification of C3 fluorescent area in (D). n = 5 mice per group. F Representative images show the engulfed PSD95 (red) puncta within IBA1+ (green) microglial cells in the brains of WT mice and AD mice, Scale bars, 5 μm. G Quantification of PSD95 puncta per IBA1+ microglial cell. n = 6 mice per group. For (B, C, E, G), data are mean ± SEM, and a one-way ANOVA followed by Tukey’s multiple comparison test was used for statistical analysis. *P < 0.05, **P < 0.01, ***P < 0.001, ****P < 0.0001, ns, not significant

References

    1. (2023) 2023 Alzheimer's disease facts and figures. Alzheimer Dement 19:1598–1695 - PubMed
    1. Jack CR, Bennett DA, Blennow K, Carrillo MC, Dunn B, Haeberlein SB, Holtzman DM, Jagust W, Jessen F, Karlawish J, et al. NIA-AA Research Framework: Toward a biological definition of Alzheimer’s disease. Alzheimers Dement. 2018;14:535–62. - PMC - PubMed
    1. Heppner FL, Ransohoff RM, Becher B. Immune attack: the role of inflammation in Alzheimer disease. Nat Rev Neurosci. 2015;16:358–72. - PubMed
    1. Perlmutter D. Preventing Alzheimer’s disease. J Am Coll Nutr. 2016;35:732–3. - PubMed
    1. Du L, Zhang Y, Chen Y, Zhu J, Yang Y, Zhang HL. Role of microglia in neurological disorders and their potentials as a therapeutic target. Mol Neurobiol. 2017;54:7567–84. - PubMed

MeSH terms