. 2025 Jan 20;44(1):19.
doi: 10.1186/s13046-025-03276-z.

CD36 enrichment in HER2-positive mesenchymal stem cells drives therapy refractoriness in breast cancer

Affiliations

CD36 enrichment in HER2-positive mesenchymal stem cells drives therapy refractoriness in breast cancer

Lorenzo Castagnoli et al. J Exp Clin Cancer Res. .

Erratum in

Abstract

Background: Growing evidence shows that the reprogramming of fatty acid (FA) metabolism plays a key role in HER2-positive (HER2 +) breast cancer (BC) aggressiveness, therapy resistance and cancer stemness. In particular, HER2 + BC has been defined as a "lipogenic disease" due to the functional and bi-directional crosstalk occurring between HER2-mediated oncogenic signaling and FA biosynthesis via FA synthase activity. In this context, the functional role exerted by the reprogramming of CD36-mediated FA uptake in HER2 + BC poor prognosis and therapy resistance remains unclear. In this study, we aimed to elucidate whether enhanced CD36 in mesenchymal HER2 + cancer stem cells (CSCs) is directly involved in anti-HER2 treatment refractoriness in HER2 + BC and to design future metabolism-based approaches targeting both FA reprogramming and the "root" of cancer.

Methods: Molecular, biological and functional characterization of CD36-mediated FA uptake was investigated in HER2 + BC patients, cell lines, epithelial and mesenchymal CSCs. Cell proliferation was analyzed by SRB assay upon treatment with lapatinib, CD36 inhibitor, or Wnt antagonist/agonist. Engineered cell models were generated via lentivirus infection and transient silencing. CSC-like properties and tumorigenesis of HER2 + BC cells with or without CD36 depletion were examined by mammosphere forming efficiency assay, flow cytometry, cell sorting, ALDH activity assay and xenograft mouse model. FA uptake was examined by flow cytometry with FA BODIPY FL C16. Intratumor expression of CSC subsets was evaluated via multiplex immunostaining and immunolocalization analysis.

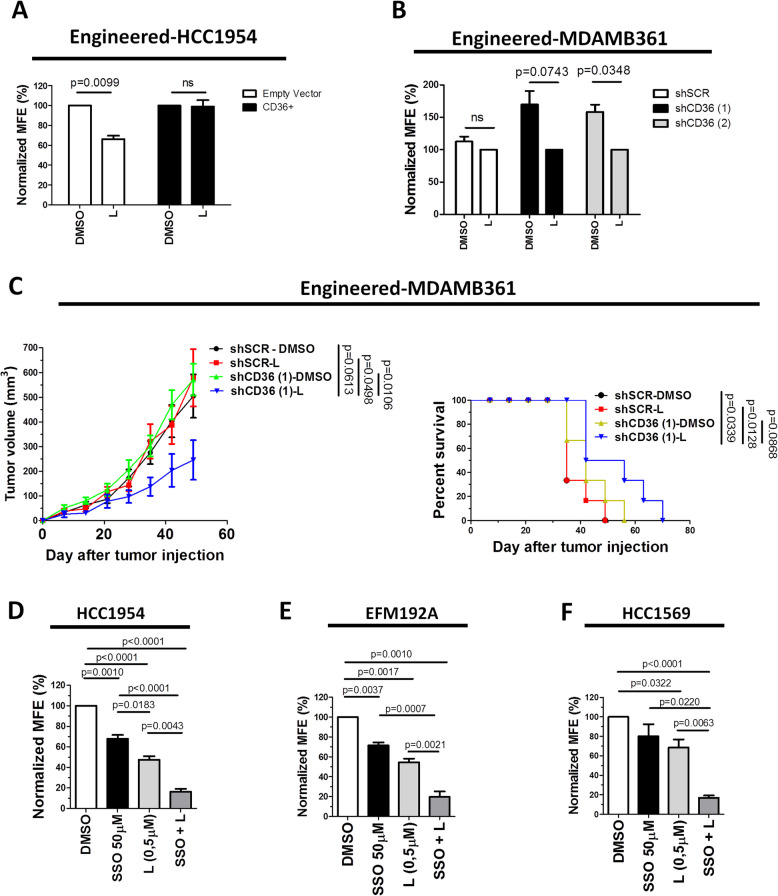
Results: Molecular data demonstrated that CD36 is significantly upmodulated on treatment in therapy resistant HER2 + BC patients and its expression levels in BC cells is correlated with FA uptake. We provided evidence of a consistent enrichment of CD36 in HER2 + epithelial-mesenchymal transition (EMT)-like CSCs from all tested resistant cell models that mechanistically occurs via Wnt signaling pathway activation. Consistently, both in vitro and in vivo dual blockade of CD36 and HER2 increased the anti-CSC efficacy of anti-HER2 drugs favoring the transition of the therapy resistant mesenchymal CSCs into therapy-sensitive mesenchymal-epithelial transition (MET)-like epithelial state. In addition, expression of CD36 in intratumor HER2 + mesenchymal CSCs is significantly associated with resistance to trastuzumab in HER2 + BC patients.

Conclusions: These results support the metabolo-oncogenic nature of CD36-mediated FA uptake in HER2 + therapy-refractory BC. Our study provides evidence that targeting CD36 might be an effective metabolic therapeutic strategy in the treatment of this malignancy.

Keywords: CD36; Cancer Stem Cells; Fatty Acid Uptake; HER2; Resistance to anti-HER2 therapy; Wnt pathway.


Conflict of interest statement

Declarations. Ethics approval and consent to participate: All procedures were performed in accordance with the Helsinki Declaration. The breast cancer biospecimens used for research consisted of leftover material from samples collected during standard surgical and medical approaches at INT. Samples were donated by patients to the Institutional BioBank for research purposes, and aliquots were allocated to this study after approval by the Institutional Review Board and a specific request to the Independent Ethics Committee of the INT (N. INT 170–20; Responsible Researcher Dr G. Pruneri). Animal experiments were approved by the Ethics Committee for Animal Experimentation of the INT according to institutional guidelines and the Italian Law (D-lgs 26/2014). In vivo experiments were approved by the Italian Ministry of Health (authorization numbers 1091/2020-PR and 74312.31.EXT.9; Resposible Researcher Dr S.M. Pupa). Consent for publication: Not applicable. Competing interests: F. Pietrantonio reports honoraria/consulting fees from Amgen, Merck-Serono, Sanofi, Ely Lilly, Bayer, Servier, Pierre-Fabre, AstraZeneca, BMS, MSD, and Organon and research grants from AstraZeneca, BMS, and Incyte. G. Pruneri reports honoraria from Eli Lilly, Roche Foundation One, Bayer, and Novartis. C. Vernieri reports research grants from Roche (to the Institution); honoraria as a speaker for educational events from Eli Lilly, Novartis, Accademia di Medicina, Fenix, and Istituto Gentili and for Advisory Board duties from Eli Lilly, Novartis, Menarini, Pfizer, and Daiichi Sankyo; and consulting fees from Eli Lilly. A. Vingiani reports honoraria from Roche. No disclosures were reported by the other authors.

Figures

Fig. 1
Fig. 1
CD36 upregulation is a marker of resistance to anti-HER2 therapy in HER2 + BC. A-B, (Left) schedule of treatment administration for HER2 + BC patients in the INT-MI series (A) and the TRUP trial (B); (right) ERBB2, FASN and CD36 transcript expression as determined by GEP in matched tumor specimens collected before and after neoadjuvant treatment in the INT-MI series (n = 32, A) and the TRUP trial (n = 17, B). Significance was calculated by two-tailed paired Student’s t test. C, rMFI of CD36 expression in anti-HER2 therapy-resistant (HCC1569, MDAMB361, EFM192-A, and HCC1954) and anti-HER2 therapy-sensitive (SKBR3, ZR7530, and BT474) HER2 + BC cell lines, as evaluated by FACS analysis. The data are presented as the means ± SEMs (n = 3). D, Pearson correlation analysis between the CD36 rMFI and BODIPY-C16 rMFI (%) in the above mentioned resistant/sensitive HER2 + BC cell lines
Fig. 2
Fig. 2
CD36 expression is enriched in EMT-like CSCs of the HER2 + BC cell population. A-B, linear regression analysis of the percentages of HER2 + /CD36 + compared with HER2 + /CD44v6 + (A) and with HER2 + /ALDH1A1 + (B) atypical malignant stem-like cells in 36 human primary HER2 + diagnostic core biopsies obtained from BC patients in the pCR Yes and pCR No groups and subjected to multiplex immunostaining and visualization by widefield microscopy. C, normalized enrichment scores (NESs) and p values of the upregulated Creighton CD44High/CD24Low MS signature (UP) and downregulated Creighton CD44High/CD24Low MS signature (DN) in the INT-MI dataset stratified according to increased (ΔCD36 +) or decreased (ΔCD36-) CD36 expression in post- vs. pre-neoadjuvant therapy biopsies. D, MFE (%) of HCC1954, MDAMB361 and HCC1569 cells sorted according to the CD36 level (CD36High vs. CD36Low). The data are presented as the means ± SEMs (n = 3); significance was calculated using two-tailed paired Student’s t test. E–F, normalized CD36 rMFI in the ALDH + (E) and CD44High/CD24Low (F) CSC subsets vs. the corresponding No CSCs subsets of HCC1954, MDAMB361, EFM192A and HCC1569 cells, as evaluated by FACS analysis. The data were normalized to the CD36 rMFI in the No CSCs subset. The data are presented as the means ± SEMs (n = 3); significance was calculated using two-tailed paired Student’s t test. G, normalized BODIPY-C16 rMFI in the CD44High/CD24Low CSC subsets vs. the corresponding No CSCs subsets of HCC1954, MDAMB361, EFM192A and HCC1569 cells, as evaluated by FACS analysis. The values were normalized to the BODIPY-C16 rMFI in the No CSCs subset. The data are presented as the means ± SEMs (n = 3); significance was calculated using two-tailed paired Student’s t test
Fig. 3
Fig. 3
CD36 expression/activity promotes the maintenance of an EMT-like CSC phenotype. A, normalized MFE (%) of engineered MDAMB361-shSCR, MDAMB361-shCD36 (1) and MDAMB361-shCD36 (2) cells cultured under MS-promoting conditions for 7 days. The data were normalized to the MFE (%) of MDAMB361-shSCR cells. The data are presented as the means ± SEMs (n = 5); significance was calculated using two-tailed paired Student’s t test. B-C, summary of data showing the percentages of CD44High/CD24Low (B) and ALDH + (C) CSCs among engineered MDAMB361-shSCR, MDAMB361-shCD36 (1) and MDAMB361-shCD36 (2) cells, as evaluated by FACS analysis. The values were normalized to the percentage of CSCs among MDAMB361-shSCR cells. The data are presented as the means ± SEMs (n = 3 in B and n = 5 in C); significance was calculated using two-tailed paired Student’s t test. D-E, Normalized MFEs (%) (Left) and representative MS pictures (Right) of EFM192A (D) and HCC1569 cells (E) transiently transfected with scrambled siRNA (siSCR) or CD36-targeting siRNA (siCD36) for 72 h. After transfection, the cells were cultured under MS-promoting conditions for 7 days. The data were normalized to the MFE (%) of EFM192A- and HCC1569-siSCR cells. The data are presented as the means ± SEMs (n = 3); significance was calculated using two-tailed paired Student’s t test. F-G, summary of data showing the percentages of CD44High/CD24Low CSCs among transiently transfected EFM192A-siSCR and EFM192A-siCD36 cells (F) and HCC1569-siSCR and HCC1569-siCD36 cells (G), as evaluated by FACS analysis. The values were normalized to the percentage of CD44High/CD24Low CSCs among siSCR cells. The data are presented as the means ± SEMs (n = 4); significance was calculated using two-tailed paired Student’s t test. H-I, summary of data showing the percentages of CD44High/CD24Low CSCs (H) and ALDH + CSCs (I) among HCC1954, MDAMB361, EFM192A and HCC1569 cells treated with DMSO or SSO (100 μM) for 48 h, as evaluated by FACS analysis. The values were normalized to the percentage of CSCs among DMSO-treated cells. The data are presented as the means ± SEMs (n = 4); significance was calculated using two-tailed paired Student’s t test. J-M summary of data showing the percentages of CD44High/CD24Low CSCs in HCC1954 (J), MDAMB361 (K), EFM192A (L) and HCC1569 (M) cells cultured in media supplemented with FBS depleted (FBS-FA-) or not (FBS-FA +) of FA for 24 h, 48 h and 72 h. The values were normalized to the percentage of CSCs in FBS-FA + cultured cells. The data are presented as the means ± SEMs (n = 5–6); significance was calculated using two-tailed paired Student’s t test
Fig. 4
Fig. 4
The Wnt pathway regulates the expression of CD36 in HER2 + BC cells. A, GSEA enrichment plots of Wnt gene sets (KEGG) in post- vs. pretreatment samples from patients in the INT-MI series based on increased (ΔCD36 + , left) or decreased (ΔCD36-, right) CD36 expression. NES: normalized enrichment score; FDR: false discovery rate. B-E, percentages of CD36 + cells among HCC1954 (B), MDAMB361 (C), EFM192A (D) and HCC1569 (E) cells after treatment for 24 h or 48 h with the WNT inhibitor LGK974 or the diluent DMSO. The data were normalized to the percentages of CD36 + cells among the corresponding DMSO-treated cells. The data are presented as the means ± SEMs (n = 4–7); significance was calculated using two-tailed paired Student’s t test. F-I, (left) catenin beta 1 expression (ß-Cat) as evaluated by Western blotting in HCC1954 (F), MDAMB361 (G), EFM192A (H) and HCC1569 (I) cells with transient silencing of CTNNB1 (siCTNNB1) or transfected with the nonspecific siRNA construct (siSCR) for 24 h and 48 h. Actin was used to normalize protein loading; (right) percentages of CD36 + cells among HCC1954 (F), MDAMB361 (G), EFM192A (H) and HCC1569 (I) cells with or without (siSCR) transient silencing of catenin beta 1 (siCTNNB1) for 24 h and 48 h. The values were normalized to the percentage of CD36 + cells among siSCR-transfected cells. The data are presented as the means ± SEMs (n = 3–4); significance was calculated using two-tailed paired Student’s t test. J-L, percentages of CD36 + cells among HCC1954 (J), MDAMB361 (K) and EFM192A (L) cells treated for 24 h with the specific WNT agonist SKL2001 (10 μM, 20 μM or 40 μM) or the diluent DMSO. The values were normalized to the percentage of CD36 + cells among DMSO-treated cells. The data are presented as the means ± SEMs (n = 4–6); significance was calculated using two-tailed paired Student’s t test
Fig. 5
Fig. 5
Dual blockade of CD36 and HER2 enhances the anti-CSC efficacy of anti-HER2 drugs in lapatinib-resistant HER2 + BC cells. A-B, normalized MFE (%) of HCC1954 cells transiently transduced with the CD36 overexpression plasmid (CD36 +) or empty vector (A) and of stably transduced MDAMB361-shSCR, MDAMB361-shCD36 (1) and MDAMB361-shCD36 (2) cells (B) treated with lapatinib (L) (0.5 μM) or DMSO. MSs were counted after 7 days of culture. The values were normalized to the MFE (%) of HCC1954-Empty Vector cells (A) or MDAMB361-shSCR cells (B). The data are presented as the means ± SEMs (n = 3); significance was calculated using two-tailed paired Student’s t test. C, in vivo tumor growth (left) and survival (right) were evaluated in SCID mice injected in a m.f.p. with 9 × 105 engineered MDAMB361-shSCR or MDAMB361-shCD36 (1) cells pretreated in vitro with lapatinib (L, 0.45 μM) or DMSO for 72 h. (Left) The data are presented as the means ± SEMs (n = 5–6); significance was calculated using two-tailed unpaired Student’s t test. Mice were sacrificed when the tumor volume reached 750 mm3. (Right) Significance was determined by the log–rank (Mantel–Cox) test. D-F, normalized MFE (%) of HCC1954 (D), EFM192A (E) and HCC1569 (F) cells treated with SSO (50 μM) and lapatinib (L 0.5 μM) alone or in combination or with DMSO as an internal control. MSs were counted after 7 days of culture. The values were normalized to the MFE (%) of DMSO-treated cells. The data are presented as the means ± SEMs (n = 4); significance was calculated using two-tailed paired Student’s t test
Fig. 6
Fig. 6
Enrichment of HER2 + /CD44v6 + /CD36 + stem-like cells is associated with resistance to therapy in HER2 + BC patients. A, representative micrographs of triple immunofluorescence staining for HER2 (brown signal), CD44v6 (pink signal) and CD36 (cyan signal) in pCR Yes and pCR No HER2 + BC biopsies. Coexpression of all three signals is indicated by the black arrows. Scale bars = 100 μm. B, quantification of the percentage of HER2 + /CD44v6 + /CD36 + atypical malignant stem-like cells in pCR Yes (n = 18) and pCR No (n = 18) HER2 + BC biopsies. Significance was calculated using two-tailed unpaired Student’s t test

References

    1. Sung H, Ferlay J, Siegel RL, Laversanne M, Soerjomataram I, Jemal A, et al. Global Cancer Statistics 2020: GLOBOCAN Estimates of Incidence and Mortality Worldwide for 36 Cancers in 185 Countries. CA Cancer J Clin. 2021;71:209–49. - PubMed
    1. Loibl S, Gianni L. HER2-positive breast cancer. Lancet. 2017;389:2415–29. - PubMed
    1. Vernieri C, Milano M, Brambilla M, Mennitto A, Maggi C, Cona MS, et al. Resistance mechanisms to anti-HER2 therapies in HER2-positive breast cancer: Current knowledge, new research directions and therapeutic perspectives. Crit Rev Oncol Hematol. 2019;139:53–66. - PubMed
    1. Hanahan D. Hallmarks of cancer: new dimensions. Cancer Discov. 2022;12:31–46. - PubMed
    1. Vernieri C, Casola S, Foiani M, Pietrantonio F, de Braud F, Longo V. Targeting cancer metabolism: dietary and pharmacologic interventions. Cancer Discov. 2016;6:1315–33. - PMC - PubMed