. 2025 Jan;31(1):e70231.
doi: 10.1111/cns.70231.

Electroacupuncture Pretreatment Reduces Ischemic Brain Injury by Inhibiting the Lactate Production and Its Derived Protein Lactylation Formation

Affiliations

Electroacupuncture Pretreatment Reduces Ischemic Brain Injury by Inhibiting the Lactate Production and Its Derived Protein Lactylation Formation

Xin-Ru Pan et al. CNS Neurosci Ther. 2025 Jan.

Abstract

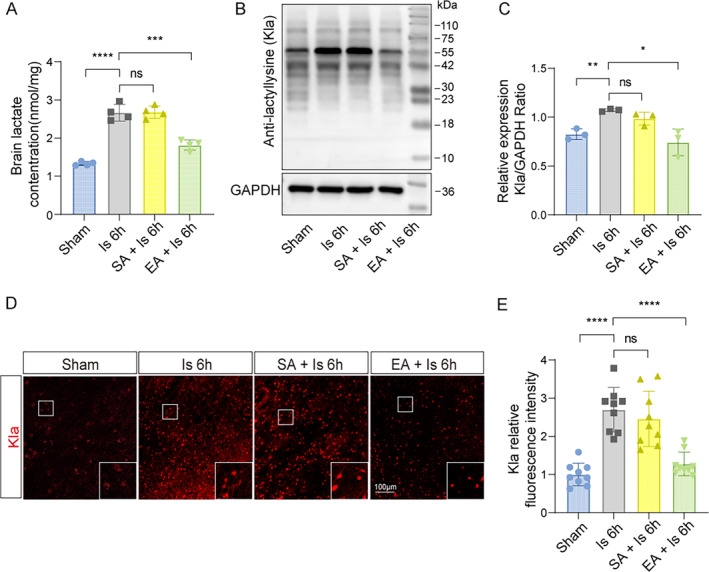
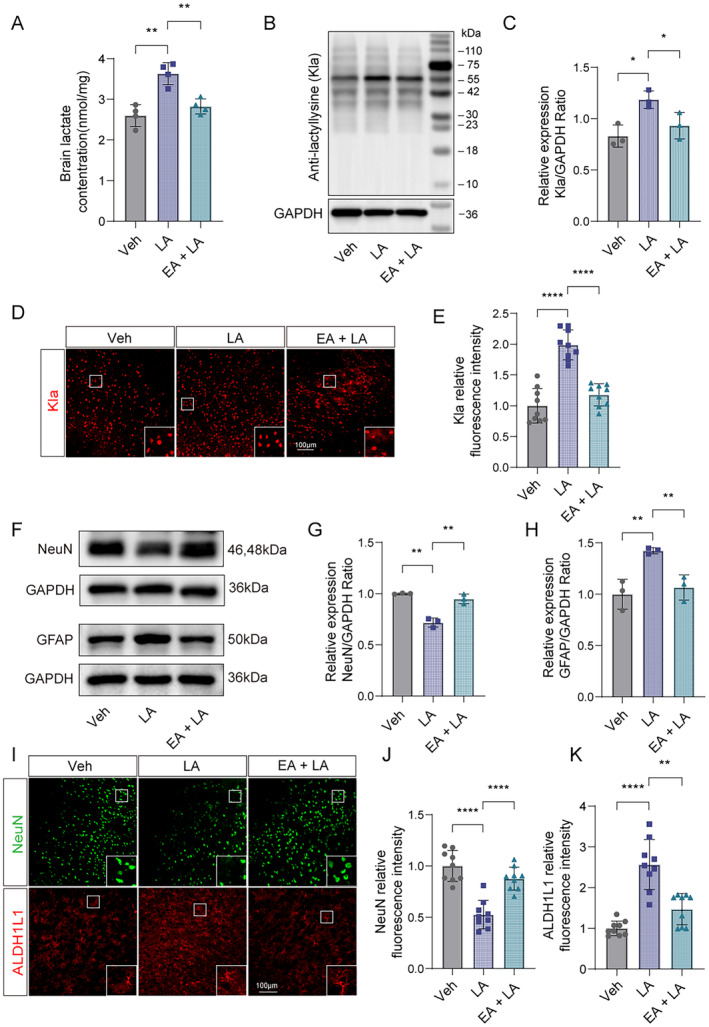
Aim: Given that electroacupuncture (EA) pretreatment inhibits lactate production and lactate-derived lysine lactation (Kla) aggravates ischemic brain injury, we aimed to investigate whether the formation of Kla protein is involved in EA pretreatment to alleviate ischemic brain injury.

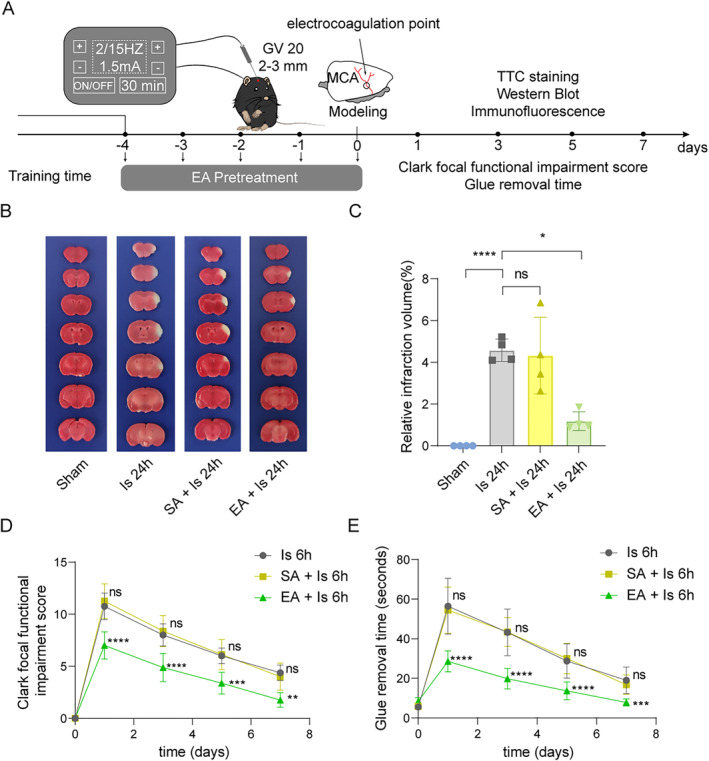
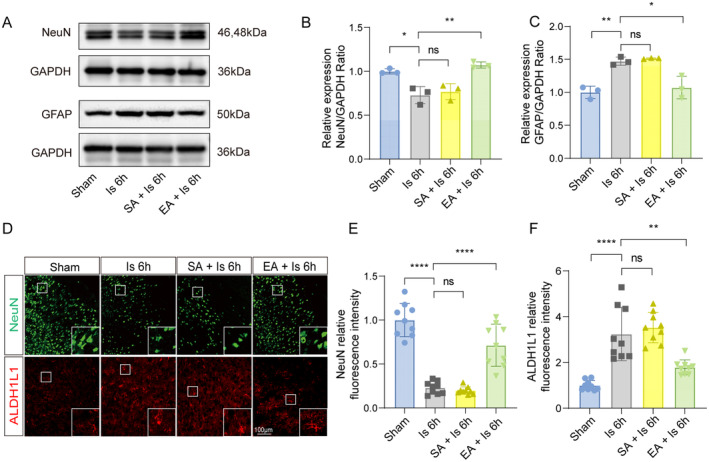
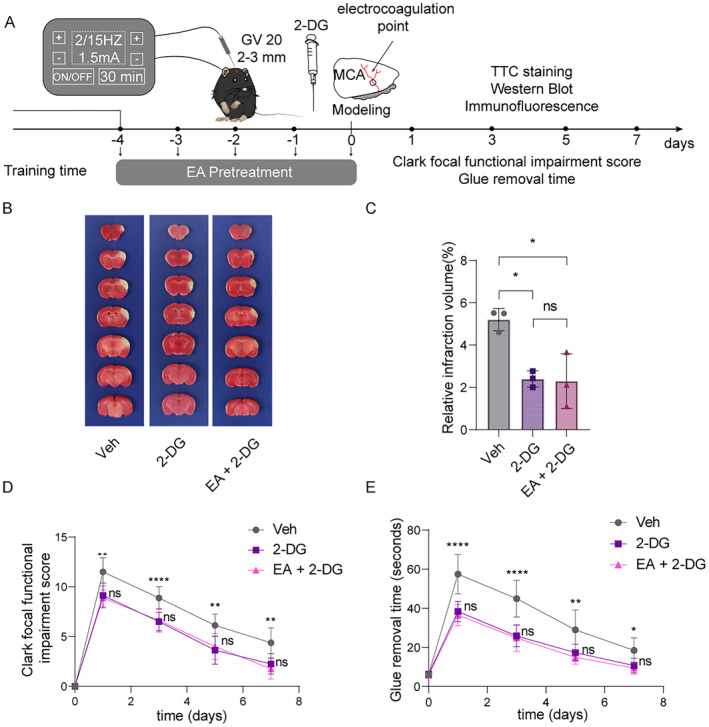
Methods: EA was performed on the Baihui acupoint (GV20) of male C57BL/6J mice before receiving the permanent middle cerebral artery occlusion (pMCAO) surgery. Western blot and immunofluorescent staining were used to observe neuronal survival, astrocyte activation, and protein Kla levels, and the lactate levels in ischemic brains were assayed with a commercial kit. TTC staining and neurological function scores are performed to evaluate the brain damage in mice.

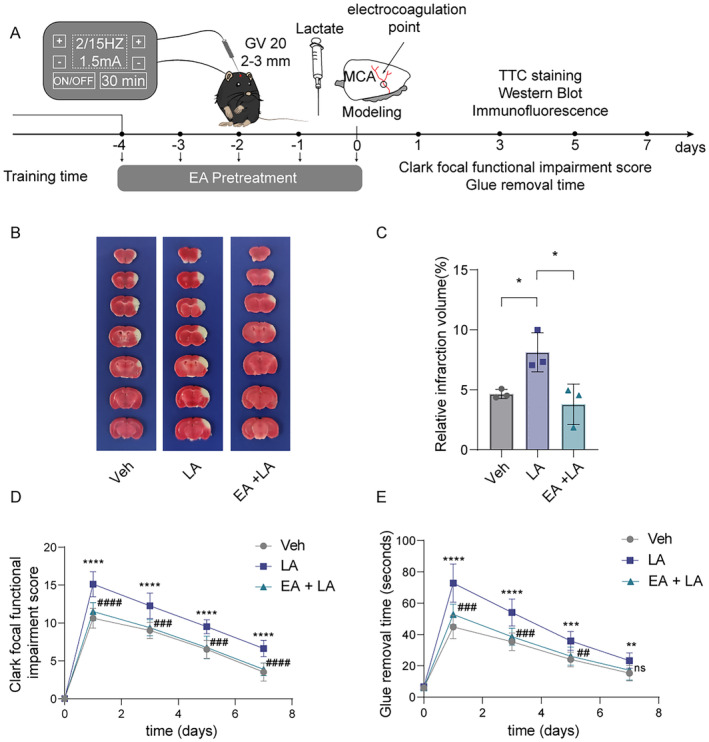
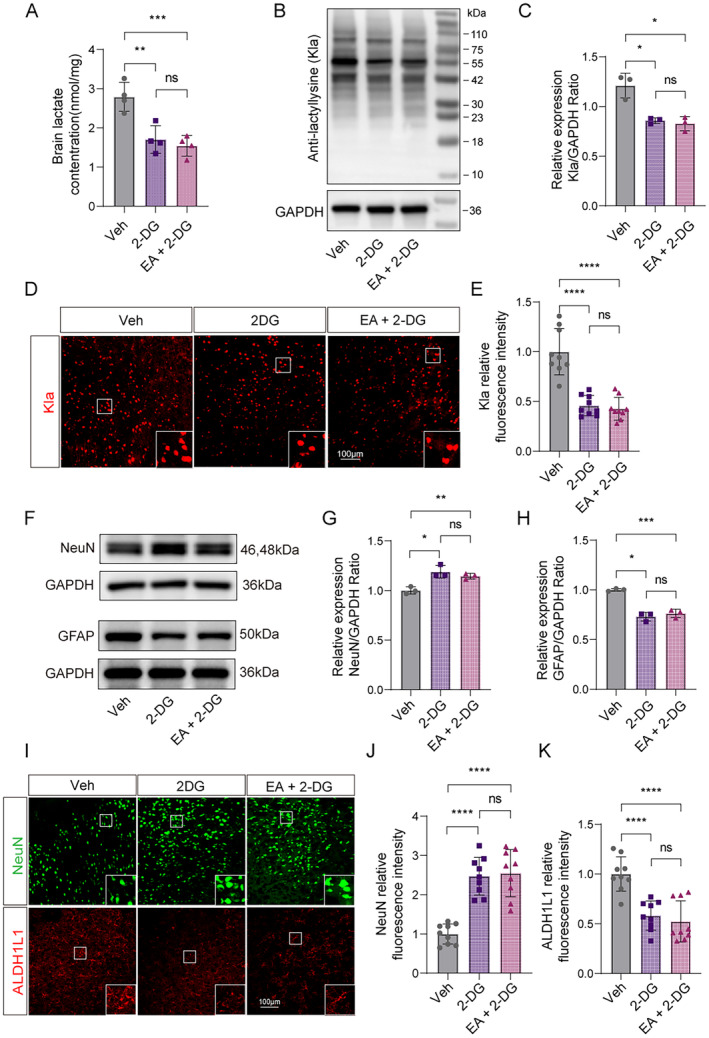
Results: We found that the increased lactate content and protein Kla levels were significantly decreased in ischemic brain tissue of mice after receiving EA pretreatment, and accompanied by the reduction of astrocyte activation and neuronal injury and death. Meantime, we found that EA pretreatment was effective in reversing the worsening of ischemic brain injury caused by lactate supplementation. However, EA pretreatment did not further reduce the lactate content and protein Kla levels and ameliorate brain injury in ischemic stroke mice after inhibition of glycolysis.

Conclusion: Our study reveals that EA pretreatment reduced ischemic brain damage by inhibiting lactate production and its derived protein Kla formation in mice with ischemic stroke.

Keywords: electroacupuncture pretreatment; glycolysis; ischemic stroke; lactate; lysine lactylation.


Conflict of interest statement

The authors declare no conflicts of interest.

Figures

FIGURE 1
FIGURE 1
EA pretreatment mitigated brain injury in mice with ischemic stroke. (A) The flowchart shows the modeling method, the timeline of EA pretreatment, and the entire experimental design. (B) Representative images of 2,3,5‐triphenyltetrazolium chloride (TTC) staining of sham, ischemic 24 h, SA (sham EA) pretreatment + ischemic 24 h, and EA pretreatment + ischemic 24 h. The infarction area is white (n = 4). (C) Statistical chart of the proportion of cerebral infarction area. (D, E) Mice with EA pretreatment and ischemic stroke show neurological function in tests of (D) Clark focal functional injury score and (E) glue remove time (n = 8). And ns means no significance between the ischemic 6 h group and the SA pretreatment + ischemic 6 h group. *means the SA pretreatment + ischemic 6 h group VS the EA pretreatment + ischemic 6 h group, *p < 0.05, **p < 0.01, ***p < 0.001, ****p < 0.0001. All data are presented as mean ± standard deviation.
FIGURE 2
FIGURE 2
EA pretreatment mitigated brain injury in mice with ischemic stroke. (A–C) The ischemic brain levels of neuroglial markers of NeuN and astrocyte markers of GFAP were measured in the tissues using western blotting at 6 h post cerebral ischemia in mice with or without EA pretreatment (n = 3). (D) Representative image of IF staining with NeuN+ neuron (green) or ALDH1L1+ astrocytes (red) in cortex of ischemic mice compared to mice with EA pretreatment. (E–F) Statistic analysis of the relative fluorescence intensity of the NeuN and ALDH1L1 per field in cortex of mice with EA pretreatment compared to ischemic mice (n = 3; three fields per sample). Scale bar = 100 μm. ns, no significance; *p < 0.05, **p < 0.01, ***p < 0.001 and ****p < 0.0001. All data are presented as mean ± standard deviation.
FIGURE 3
FIGURE 3
EA pretreatment downregulated lactate levels and Kla formation in ischemic brain tissue of mice after ischemic stroke. (A) Lactate levels in the ischemic brain at 6 h were measured in mice with or without EA pretreatment (n = 4). (B, C) The ischemic brain levels of markers of lysine lactylation modification of Kla were measured in the tissues using western blotting at 6 h post cerebral ischemia in mice with or without EA pretreatment (n = 3). (D) Representative image of IF staining with Kla in cortex of ischemic mice compared to mice with EA pretreatment. (E) Statistic analysis of the relative fluorescence intensity of the Kla per field in cortex of mice with EA pretreatment compared to ischemic mice (n = 3; three fields per sample). Scale bar = 100 μm. All data are presented as mean ± standard deviation. ns, no significance; *p < 0.05, **p < 0.01, ***p < 0.001 and ****p < 0.0001.
FIGURE 4
FIGURE 4
EA pretreatment effectively reversed the aggravation of ischemic brain injury caused by lactate supplementation via downregulating the formation of protein Kla. (A) The flowchart shows the modeling method, the timeline of EA pretreatment and lactate pretreatment, and the entire experimental design. (B) Representative images of 2,3,5‐triphenyltetrazolium chloride (TTC) staining of vehicle (saline), lactate and lactate + EA pretreatment after ischemia 24 h. The infarction area is white (n = 3). (C) Statistical chart of the proportion of cerebral infarction area. (D, E) Mice with lactate pretreatment and lactate + EA pretreatment show neurological function in tests of (D) Clark focal functional injury score and (E) glue remove time (n = 8). And *means the Veh group VS the LA group, *p < 0.05, **p < 0.01, ***p < 0.001, ****p < 0.0001. #means the LA group VS the EA + LA group, # p < 0.05, ## p < 0.01, ### p < 0.001, #### p < 0.0001. All data are presented as mean ± standard deviation. Veh indicates Vehicle.
FIGURE 5
FIGURE 5
EA pretreatment effectively reversed the aggravation of ischemic brain injury caused by lactate supplementation via downregulating the formation of protein Kla. (A) Lactate levels in the brain with lactate pretreatment after ischemic 6 h were measured in mice with or without EA pretreatment (n = 4). (B, C) The ischemic brain levels of markers of lysine lactylation modification of Kla were measured in the lactate pretreatment brain tissues using western blotting at 6 h post cerebral ischemia in mice with or without EA pretreatment (n = 3). (D) Representative image of IF staining with Kla + in only lactate pretreatment cortex of ischemic mice compared to mice with lactate + EA pretreatment. (E) Statistic analysis of the relative fluorescence intensity of the Kla per field in cortex of mice with lactate + EA pretreatment compared to lactate pretreatment ischemic mice (n = 3; three fields per sample). (F–H) The ischemic brain levels of neuroglial markers of NeuN and astrocyte markers of GFAP were measured in the tissues using western blotting at 6 h post cerebral ischemia with lactate pretreatment in mice with or without EA pretreatment (n = 3). (I) Representative image of IF staining with NeuN+ neuron (green) or ALDH1L1+ astrocytes (red) in cortex of ischemic mice with lactate pretreatment compared to mice with lactate + EA pretreatment. (J, K) Statistic analysis of the relative fluorescence intensity of the Neun and ALDH1L per field in cortex of mice with lactate + EA pretreatment compared to lactate pretreatment only (n = 3; three fields per sample). Scale bar = 100 μm. ns, no significance; *p < 0.05, **p < 0.01, ***p < 0.001 and ****p < 0.0001 . All data are presented as mean ± standard deviation. Veh indicates Vehicle.
FIGURE 6
FIGURE 6
EA pretreatment failed to further reduce the brain injury of mice with ischemic stroke after glycolysis inhibition by 2DG supplementation. (A) The flowchart shows the modeling method, the timeline of EA pretreatment and 2‐DG pretreatment, and the entire experimental design. (B) Representative images of 2,3,5‐triphenyltetrazolium chloride (TTC) staining of vehicle (saline), 2‐DG and 2‐DG + EA pretreatment after ischemia 24 h. The infarction area is white (n = 3). (C) Statistical chart of the proportion of cerebral infarction area. (D, E) Mice with lactate pretreatment and 2‐DG + EA pretreatment show neurological function in tests of (D) Clark focal functional injury score and (E) glue remove time (n = 8). And *means the Veh group VS the 2‐DG group, *p < 0.05, **p < 0.01, ***p < 0.001, ****p < 0.0001. #means the 2‐DG group VS the EA + 2‐DG group, # p < 0.05, ## p < 0.01, ### p < 0.001, #### p < 0.0001. All data are presented as mean ± standard deviation. Veh indicates Vehicle.
FIGURE 7
FIGURE 7
EA pretreatment failed to further reduce the brain injury of mice with ischemic stroke after glycolysis inhibition by 2DG supplementation. (A) Lactate levels in the brain with 2‐DG pretreatment after ischemic 6 h were measured in mice with or without EA pretreatment (n = 4). (B, C) The ischemic brain levels of markers of lysine lactylation modification of Kla were measured in the 2‐DG pretreatment brain tissues using western blotting at 6 h post cerebral ischemia in mice with or without EA pretreatment (n = 3). (D) Representative image of IF staining with Kla in only 2‐DG pretreatment cortex of ischemic mice compared to mice with 2‐DG + EA pretreatment. E Statistic analysis of the relative fluorescence intensity of the Kla per field in cortex of mice with 2‐DG + EA pretreatment compared to lactate pretreatment ischemic mice (n = 3; three fields per sample). (F–H) The ischemic brain levels of neuroglial markers of NeuN and astrocyte markers of GFAP were measured in the tissues using western blotting at 6 h post cerebral ischemia with 2‐DG pretreatment in mice with or without EA pretreatment (n = 3). I Representative image of IF staining with NeuN+ neuron (green) or ALDH1L1+ astrocytes (red) in cortex of ischemic mice with 2‐DG pretreatment compared to mice with 2‐DG + EA pretreatment. (J, K) Statistic analysis of the relative fluorescence intensity of the Neun and ALDH1L1 per field in cortex of mice with 2‐DG + EA pretreatment compared to 2‐DG pretreatment only (n = 3; three fields per sample). Scale bar = 100 μm. *p < 0.05, **p < 0.01, ***p < 0.001 and ****p < 0.0001. All data are presented as mean ± standard deviation. ns, no significance; Veh indicates Vehicle.

Similar articles

Cited by

References

    1. Virani S. S., Alonso A., Benjamin E. J., et al., “Heart Disease and Stroke Statistics‐2020 Update: A Report From the American Heart Association,” Circulation 141, no. 9 (2020): e139–e596. - PubMed
    1. Goyal M., Hill M. D., Saver J. L., and Fisher M., “Challenges and Opportunities of Endovascular Stroke Therapy,” Annals of Neurology 79, no. 1 (2016): 11–17. - PubMed
    1. Saver J. L., Goyal M., van der Lugt A., et al., “Time to Treatment With Endovascular Thrombectomy and Outcomes From Ischemic Stroke: A Meta‐Analysis,” JAMA 316, no. 12 (2016): 1279–1288. - PubMed
    1. Fransen P. S., Berkhemer O. A., Lingsma H. F., et al., “Time to Reperfusion and Treatment Effect for Acute Ischemic Stroke: A Randomized Clinical Trial,” JAMA Neurology 73, no. 2 (2016): 190–196. - PubMed
    1. Chia N. H., Leyden J. M., Newbury J., Jannes J., and Kleinig T. J., “Determining the Number of Ischemic Strokes Potentially Eligible for Endovascular Thrombectomy: A Population‐Based Study,” Stroke 47, no. 5 (2016): 1377–1380. - PubMed

LinkOut - more resources