. 2025 Jan 6:15:1515778.
doi: 10.3389/fgene.2024.1515778. eCollection 2024.

Differential regulation of apoptosis-related genes during long-term culture and differentiation of canine adipose-derived stem cells - a functional bioinformatical analysis

Affiliations

Differential regulation of apoptosis-related genes during long-term culture and differentiation of canine adipose-derived stem cells - a functional bioinformatical analysis

Maurycy Jankowski et al. Front Genet. .

Abstract

Introduction: Stem cells derived from adipose tissue are gaining popularity in the field of regenerative medicine due to their adaptability and clinical potential. Their rapid growth, ability to differentiate, and easy extraction with minimal complications make adipose-derived stem cells (ADSCs) a promising option for many treatments, particularly those targeting bone-related diseases. This study analyzed gene expression in canine ADSCs subjected to long-term culture and osteogenic differentiation.

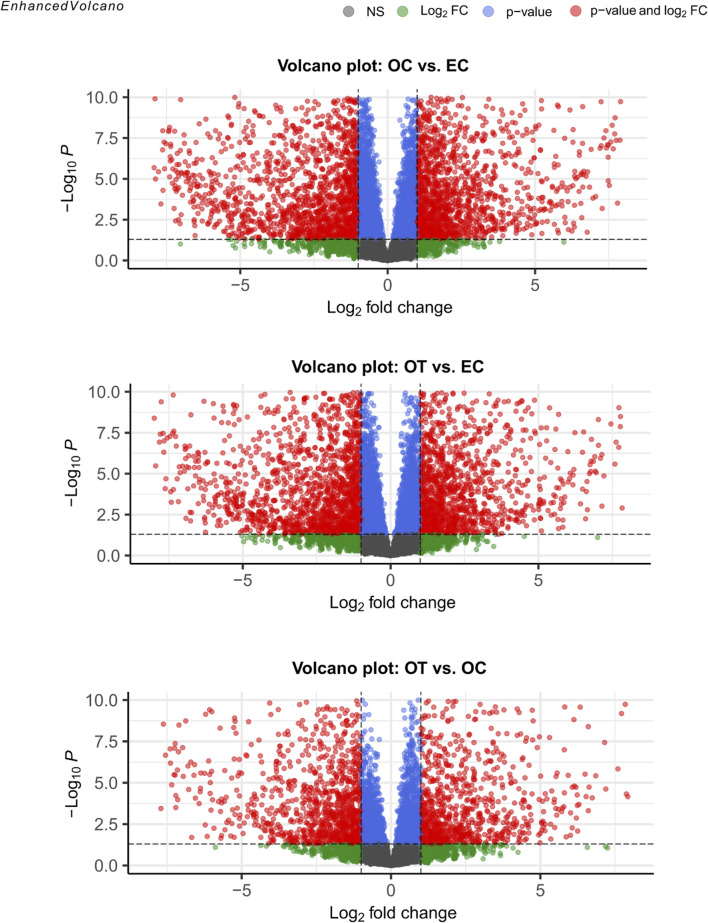
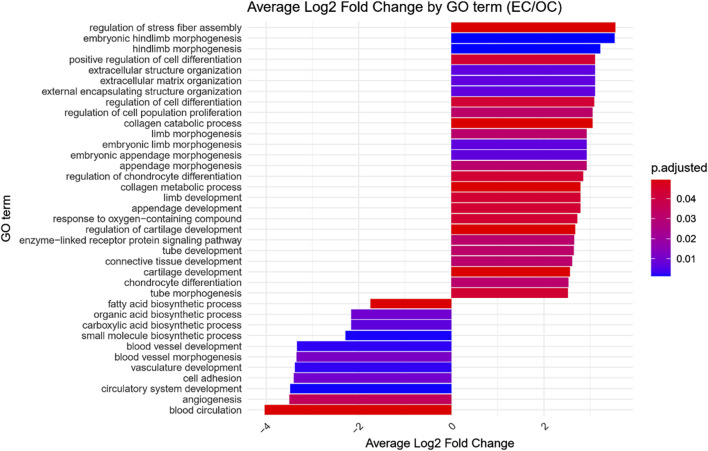
Methods: ADSCs were isolated from discarded surgical waste and cultured for 14 days with and without differentiation media to assess osteogenic changes. RNA sequencing (RNA-seq) and bioinformatical analysis were performed to obtain comprehensive transcriptomic data. A total of 17793 genes were detected and GO enrichment analysis was performed on the differentially expressed genes to identify significantly up- and downregulated Biological Process (BP) GO terms across each comparison.

Results: The upregulation of apoptosis-regulating genes and genes related to circulatory system development suggest an induction of these processes, while the downregulation of neurogenesis and gliogenesis genes points to reciprocal regulation during osteogenic differentiation of canine ADSCs.

Discussion: These findings underscore the potential of ADSCs in bone regeneration and offer valuable insights for advancing tissue engineering, however further studies, including proteomic analyses, are needed to confirm these patterns and their biological significance.

Keywords: adipose tissue; apoptosis; gene expression; gene ontology; stem cells; transcriptomics.


Conflict of interest statement

The authors declare that the research was conducted in the absence of any commercial or financial relationships that could be construed as a potential conflict of interest.

Figures

FIGURE 1
FIGURE 1
PCA results of the analyzed samples. EC- early control (24 h), OC-late control (14 days), OT-differentiated osteoblasts. The x-axis represents the first principal component (PC1), explaining 52.79% of the variance, while the y-axis represents the second principal component (PC2), explaining 23.60% of the variance. Samples within the same group cluster together, indicating similar expression patterns, while distinct separation between groups reflects differences in gene expression profiles.
FIGURE 2
FIGURE 2
Volcano plots visualization of differential gene expression analysis. The red points denote genes that met the conditions for differential gene expression (Log2FC ≥ 1 and FDR < 0.05). Green points indicate genes that met the fold change criterion but did not meet significance conditions, while blue points mark genes that only met the latter. Finally, grey points indicated genes that did not meet any of the DEG conditions.
FIGURE 3
FIGURE 3
Bar graph presenting GO terms differentially enriched between the early control (24 h) and osteoblast control (14 days) cultures.The size of the bars represent the average fold-change of differentially expresed genes in the enriched groups, while the color of the bar represents the adjusted p-value of the GO enrichment (red-higher, blue-lower).
FIGURE 4
FIGURE 4
Bar graph presenting GO terms differentially enriched between the early control (24 h) and differentiated osteoblast cultures. The size of the bars represent the average fold-change of differentially expresed genes in the enriched groups, while the color of the bar represents the adjusted p-value of the GO enrichment (red-higher, blue-lower).
FIGURE 5
FIGURE 5
Bar graph presenting GO terms differentially enriched between the osteoblast control (14 days) and differentiated osteoblast cultures. The size of the bars represent the average fold-change of differentially expresed genes in the enriched groups, while the color of the bar represents the adjusted p-value of the GO enrichment (red-higher, blue-lower).
FIGURE 6
FIGURE 6
A tree plot presenting the results of hierarchical clustering of the GO terms positively enriched between Early control (24 h) and osteoblast control (14 days) culture. The GO terms were clustered based on the data contained in the GO database, with larger clusters marked with different colors. The size of the circle next to the GO name represents the number of differentially expressed genes present in this GO, while the color marks the p-value of the GO enrichment (blue-higher, red-lower). The clusters are annotated with keywords that most often repeat in the GO terms contained within).
FIGURE 7
FIGURE 7
A tree plot presenting the results of hierarchical clustering of the GO terms negatively enriched between Early control (24 h) and osteoblast control (14 days) culture. The GO terms were clustered based on the data contained in the GO database, with larger clusters marked with different colors. The size of the circle next to the GO name represents the number of differentially expressed genes present in this GO, while the color marks the p-value of the GO enrichment (blue-higher, red-lower). The clusters are annotated with keywords that most often repeat in the GO terms contained within).
FIGURE 8
FIGURE 8
A tree plot presenting the results of hierarchical clustering of the GO terms positively enriched between early control (24 h) and differentiated osteoblast (14 days) culture. The GO terms were clustered based on the data contained in the GO database, with larger clusters marked with different colors. The size of the circle next to the GO name represents the number of differentially expressed genes present in this GO, while the color marks the p-value of the GO enrichment (blue-higher, red-lower). The clusters are annotated with keywords that most often repeat in the GO terms contained within).
FIGURE 9
FIGURE 9
A tree plot presenting the results of hierarchical clustering of the GO terms negatively enriched between early control (24 h) and differentiated osteoblast (14 days) culture. The GO terms were clustered based on the data contained in the GO database, with larger clusters marked with different colors. The size of the circle next to the GO name represents the number of differentially expressed genes present in this GO, while the color marks the p-value of the GO enrichment (blue-higher, red-lower). The clusters are annotated with keywords that most often repeat in the GO terms contained within).
FIGURE 10
FIGURE 10
A tree plot presenting the results of hierarchical clustering of the GO terms positively enriched between osteoblast control (14 days) and differentiated osteoblast (14 days) culture. The GO terms were clustered based on the data contained in the GO database, with larger clusters marked with different colors. The size of the circle next to the GO name represents the number of differentially expressed genes present in this GO, while the color marks the p-value of the GO enrichment (blue-higher, red-lower). The clusters are annotated with keywords that most often repeat in the GO terms contained within).
FIGURE 11
FIGURE 11
A tree plot presenting the results of hierarchical clustering of the GO terms negatively enriched between osteoblast control (14 days) and differentiated osteoblast (14 days) culture. The GO terms were clustered based on the data contained in the GO database, with larger clusters marked with different colors. The size of the circle next to the GO name represents the number of differentially expressed genes present in this GO, while the color marks the p-value of the GO enrichment (blue-higher, red-lower). The clusters are annotated with keywords that most often repeat in the GO terms contained within).
FIGURE 12
FIGURE 12
The map of KEGG pathways differentially enriched between the early control and late control cultures. The circles on the map represent enriched pathways, with their size indicating the number of differentially expressed genes contained in the pathway, and the color denoting the adjusted p-value of the enrichment (blue-higher, red-lower). The lines connecting the pathway indicate the presence of common genes between the connected pathways, with a thicker line representing a bigger number of genes in common.
FIGURE 13
FIGURE 13
The map of KEGG pathways differentially enriched between the early control and differentiated osteoblast cultures. The circles on the map represent enriched pathways, with their size indicating the number of differentially expressed genes contained in the pathway, and the color denoting the adjusted p-value of the enrichment (blue-higher, red-lower). The lines connecting the pathway indicate the presence of common genes between the connected pathways, with a thicker line representing a bigger number of genes in common.
FIGURE 14
FIGURE 14
The map of KEGG pathways differentially enriched between the late control and differentiated osteoblast cultures. The circles on the map represent enriched pathways, with their size indicating the number of differentially expressed genes contained in the pathway, and the color denoting the adjusted p-value of the enrichment (blue-higher, red-lower). The lines connecting the pathway indicate the presence of common genes between the connected pathways, with a thicker line representing a bigger number of genes in common.

References

    1. Andrzejewska A., Lukomska B., Janowski M. (2019). Concise review: mesenchymal stem cells: from roots to boost. Stem Cells 37, 855–864. 10.1002/stem.3016 - DOI - PMC - PubMed
    1. Armesilla-Diaz A., Elvira G., Silva A. (2009). P53 regulates the proliferation, differentiation and spontaneous transformation of mesenchymal stem cells. Exp. Cell Res. 315, 3598–3610. 10.1016/J.YEXCR.2009.08.004 - DOI - PubMed
    1. Bajek A., Gurtowska N., Olkowska J., Maj M., Kaźmierski Ł., Bodnar M., et al. (2017). Does the harvesting technique affect the properties of adipose-derived stem cells? the comparative biological characterization. J. Cell Biochem. 118, 1097–1107. 10.1002/jcb.25724 - DOI - PubMed
    1. Bieback K., Hecker A., Schlechter T., Hofmann I., Brousos N., Redmer T., et al. (2012). Replicative aging and differentiation potential of human adipose tissue-derived mesenchymal stromal cells expanded in pooled human or fetal bovine serum. Cytotherapy 14, 570–583. 10.3109/14653249.2011.652809 - DOI - PubMed
    1. Bonab M. M., Alimoghaddam K., Talebian F., Ghaffari S. H., Ghavamzadeh A., Nikbin B. (2006). Aging of mesenchymal stem cell in vitro . BMC Cell Biol. 7, 14. 10.1186/1471-2121-7-14 - DOI - PMC - PubMed