

Prognostic nutritional index as a predictor of cardiovascular and all-cause mortality in American adults with hypertension: results from the NHANES database
- PMID: 39834734
- PMCID: PMC11743961
- DOI: 10.3389/fcvm.2024.1465379
Prognostic nutritional index as a predictor of cardiovascular and all-cause mortality in American adults with hypertension: results from the NHANES database
Abstract
Background: Few studies have examined the relationship between nutritional status, as assessed by the Prognostic Nutrition Index (PNI), and incident cardiovascular mortality and all-cause mortality, particularly in hypertensive patients. This study aimed to examine the association between PNI and cardiovascular mortality and all-cause mortality in Americans with hypertension.
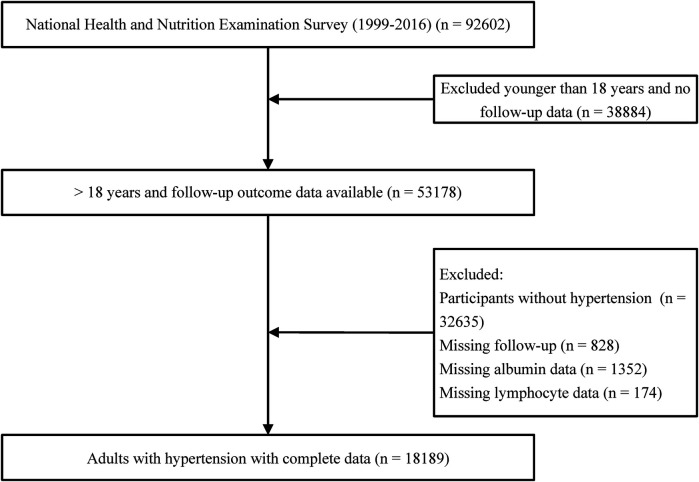
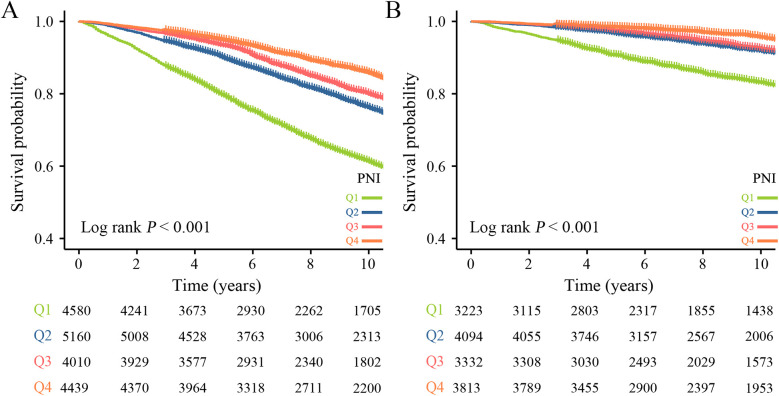
Methods: Data from this retrospective cohort study were obtained from the National Health and Nutrition Examination (NHANES) 1999-2016. Using data of The NHANES Public-Use Linked Mortality Files to assess all-cause mortality (ACM) and cardiovascular mortality (CVM). After excluding participants younger than 18 years, without hypertension, and with missing follow-up data, a total of 18,189 cases were included in this study. Persons with hypertension were divided by PNI into 4 groups: Q1 (PNI < 49.0), Q2 (PNI: 49.0-52.5), Q3 (PNI: 52.5-55.5), and Q4 (PNI > 55.5). We used the Cox proportional hazard regression model to explore the predictive role of PNI on ACM and CVM in American adults with hypertension. Restricted cubic spline (RCS) curves to investigate the existence of a dose-response linear relationship between them.
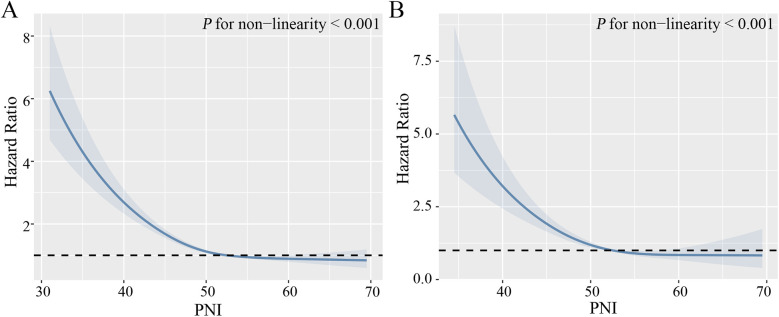
Result: During a median follow-up period of 89 months, a total of 1,444 (7.94%) cardiovascular deaths occurred and 5,171 (28.43%) all-cause deaths occurred. Multifactorial COX regression analysis showed all-cause mortality [hazard ratio (HR): 0.584, 95% CI: 0.523-0.652, p < 0.001] and cardiovascular mortality (HR: 0.435, 95% CI: 0.349-0.541, p < 0.001) associated with Q4 group risk of malnutrition in PNI compared to Q1 group. RCS curves showed a nonlinear relationship between PNI and all-cause mortality and cardiovascular mortality (both non-linear p < 0.001).
Conclusions: Lower PNI levels are associated with mortality in patients with hypertension. PNI may be a predictor of all-cause mortality and cardiovascular mortality risk in patients with hypertension.
Keywords: all-cause mortality; cardiovascular mortality; cohort study; hypertension; prognostic nutritional index.
© 2025 Tang, Yang, Yang, Li, Zhu, Li and Gao.
Conflict of interest statement
The authors declare that the research was conducted in the absence of any commercial or financial relationships that could be construed as a potential conflict of interest.
Figures
Similar articles
-
Geriatric Nutrition Risk Index as a predictor of cardiovascular and all-cause mortality in older Americans with diabetes.Diabetol Metab Syndr. 2023 May 2;15(1):89. doi: 10.1186/s13098-023-01060-7. Diabetol Metab Syndr. 2023. PMID: 37127636 Free PMC article.
-
Association of prognostic nutritional index with mortalities in American adult cancer survivors: A cohort study based on NHANES, 1999-2018.Food Sci Nutr. 2023 Nov 30;12(3):1834-1846. doi: 10.1002/fsn3.3877. eCollection 2024 Mar. Food Sci Nutr. 2023. PMID: 38455180 Free PMC article.
-
Association of prognostic nutritional index with all-cause and cardiovascular mortality in adults with depression: NHANES 2005-2018.Front Nutr. 2025 May 19;12:1599830. doi: 10.3389/fnut.2025.1599830. eCollection 2025. Front Nutr. 2025. PMID: 40458829 Free PMC article.
-
Association between extremely high prognostic nutritional index and all-cause mortality in patients with coronary artery disease: secondary analysis of a prospective cohort study in China.BMJ Open. 2024 Jun 16;14(6):e079954. doi: 10.1136/bmjopen-2023-079954. BMJ Open. 2024. PMID: 38885991 Free PMC article.
-
Association of oxidative balance score, cardiovascular, and all-cause mortality among patients with type 2 diabetes mellitus.Front Endocrinol (Lausanne). 2024 Aug 20;15:1429662. doi: 10.3389/fendo.2024.1429662. eCollection 2024. Front Endocrinol (Lausanne). 2024. PMID: 39229371 Free PMC article.
Cited by
-
Threshold effect of prognostic nutritional index on mortality in geriatric hip fracture patients.Sci Rep. 2025 Jul 1;15(1):22241. doi: 10.1038/s41598-025-08123-x. Sci Rep. 2025. PMID: 40596547 Free PMC article.
-
The prognostic nutritional index as a predictor of cardiovascular and all-cause mortality in chronic kidney disease: a population-based analysis of NHANES data (1999-2018).Front Med (Lausanne). 2025 Jun 6;12:1589173. doi: 10.3389/fmed.2025.1589173. eCollection 2025. Front Med (Lausanne). 2025. PMID: 40547920 Free PMC article.
-
Association between prognostic nutritional index and all-cause mortality among intestinal obstruction patients in the intensive care unit: a retrospective study.Front Nutr. 2025 Jun 9;12:1583201. doi: 10.3389/fnut.2025.1583201. eCollection 2025. Front Nutr. 2025. PMID: 40551734 Free PMC article.
References
LinkOut - more resources
Full Text Sources