

Comparison between traditional logistic regression and machine learning for predicting mortality in adult sepsis patients
- PMID: 39835102
- PMCID: PMC11743956
- DOI: 10.3389/fmed.2024.1496869
Comparison between traditional logistic regression and machine learning for predicting mortality in adult sepsis patients
Abstract
Background: Sepsis is a life-threatening disease associated with a high mortality rate, emphasizing the need for the exploration of novel models to predict the prognosis of this patient population. This study compared the performance of traditional logistic regression and machine learning models in predicting adult sepsis mortality.
Objective: To develop an optimum model for predicting the mortality of adult sepsis patients based on comparing traditional logistic regression and machine learning methodology.
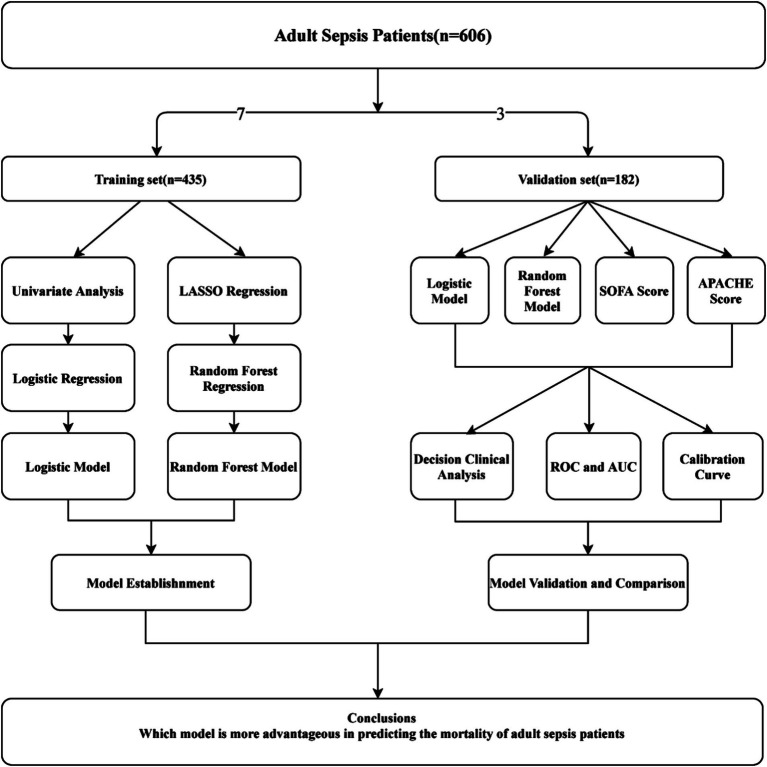
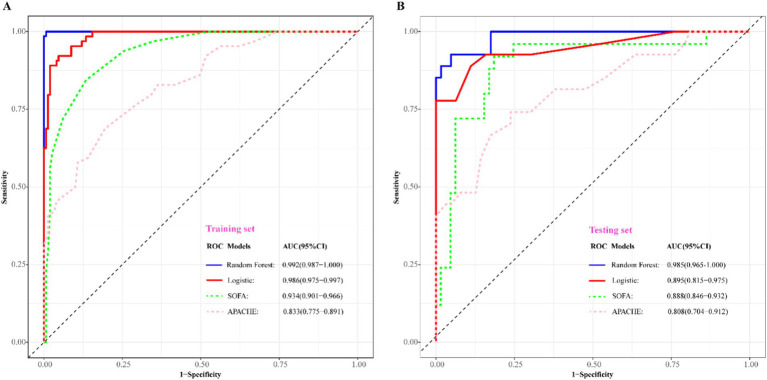
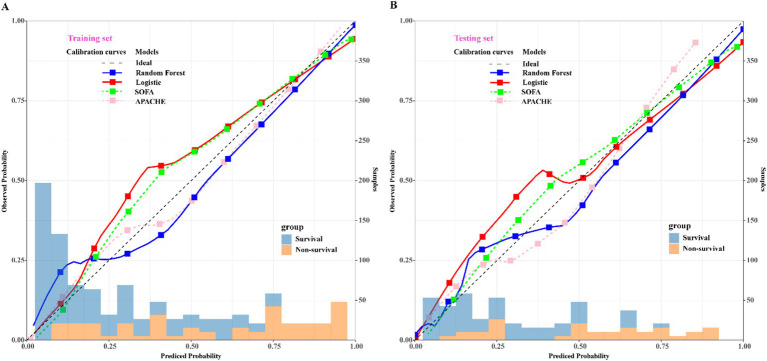
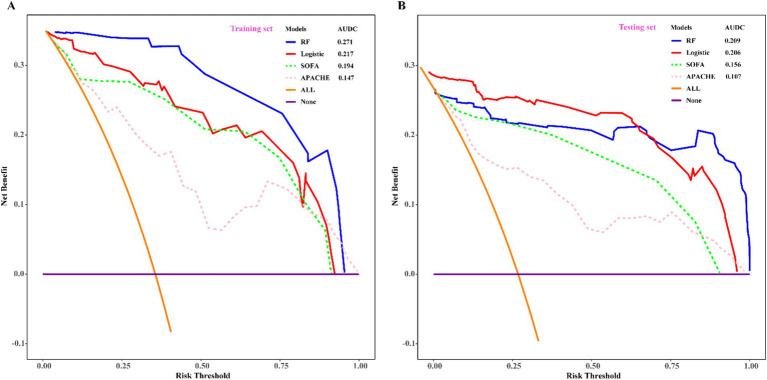
Methods: Retrospective analysis was conducted on 606 adult sepsis inpatients at our medical center between January 2020 and December 2022, who were randomly divided into training and validation sets in a 7:3 ratio. Traditional logistic regression and machine learning methods were employed to assess the predictive ability of mortality in adult sepsis. Univariate analysis identified independent risk factors for the logistic regression model, while Least Absolute Shrinkage and Selection Operator (LASSO) regression facilitated variable shrinkage and selection for the machine learning model. Among various machine learning models, which included Bagged Tree, Boost Tree, Decision Tree, LightGBM, Naïve Bayes, Nearest Neighbors, Support Vector Machine (SVM), and Random Forest (RF), the one with the maximum area under the curve (AUC) was chosen for model construction. Model validation and comparison with the Sequential Organ Failure Assessment (SOFA) and the Acute Physiology and Chronic Health Evaluation (APACHE) scores were performed using receiver operating characteristic (ROC) curves, calibration curves, and decision curve analysis (DCA) curves in the validation set.
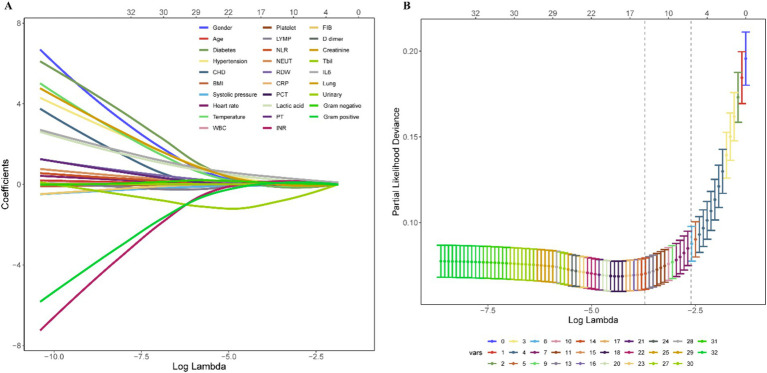
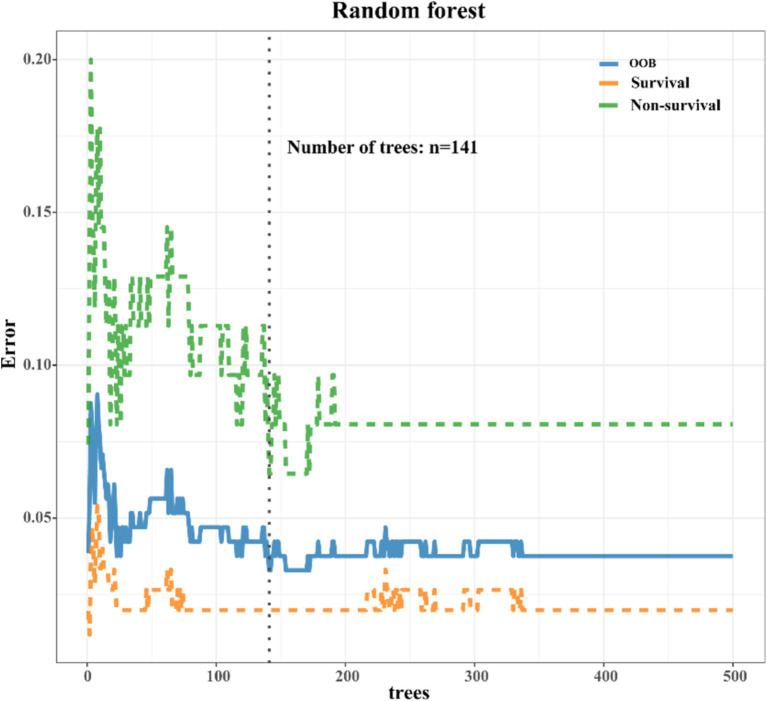
Results: Univariate analysis was employed to assess 17 variables, namely gender, history of coronary heart disease (CHD), systolic pressure, white blood cell (WBC), neutrophil count (NEUT), lymphocyte count (LYMP), lactic acid, neutrophil-to-lymphocyte ratio (NLR), red blood cell distribution width (RDW), interleukin-6 (IL-6), prothrombin time (PT), international normalized ratio (INR), fibrinogen (FBI), D-dimer, aspartate aminotransferase (AST), total bilirubin (Tbil), and lung infection. Significant differences (p < 0.05) between the survival and non-survival groups were observed for these variables. Utilizing stepwise regression with the "backward" method, independent risk factors, including systolic pressure, lactic acid, NLR, RDW, IL-6, PT, and Tbil, were identified. These factors were then incorporated into a logistic regression model, chosen based on the minimum Akaike Information Criterion (AIC) value (98.65). Machine learning techniques were also applied, and the RF model, demonstrating the maximum Area Under the Curve (AUC) of 0.999, was selected. LASSO regression, employing the lambda.1SE criteria, identified systolic pressure, lactic acid, NEUT, RDW, IL6, INR, and Tbil as variables for constructing the RF model, validated through ten-fold cross-validation. For model validation and comparison with traditional logistic models, SOFA, and APACHE scoring.
Conclusion: Based on deep machine learning principles, the RF model demonstrates advantages over traditional logistic regression models in predicting adult sepsis prognosis. The RF model holds significant potential for clinical surveillance and interventions to enhance outcomes for sepsis patients.
Keywords: adult sepsis; logistic regression; machine learning; mortality; random forest.
Copyright © 2025 Wu, Liao, Ji, Ma, Luo and Zhang.
Conflict of interest statement
The authors declare that the research was conducted in the absence of any commercial or financial relationships that could be construed as a potential conflict of interest.
Figures
Similar articles
-
Establishment of a mortality risk nomogram for predicting in-hospital mortality of sepsis: cohort study from a Chinese single center.Front Med (Lausanne). 2024 May 3;11:1360197. doi: 10.3389/fmed.2024.1360197. eCollection 2024. Front Med (Lausanne). 2024. PMID: 38765257 Free PMC article.
-
[Constructing a predictive model for the death risk of patients with septic shock based on supervised machine learning algorithms].Zhonghua Wei Zhong Bing Ji Jiu Yi Xue. 2024 Apr;36(4):345-352. doi: 10.3760/cma.j.cn121430-20230930-00832. Zhonghua Wei Zhong Bing Ji Jiu Yi Xue. 2024. PMID: 38813626 Chinese.
-
[Construction of a predictive model for in-hospital mortality of sepsis patients in intensive care unit based on machine learning].Zhonghua Wei Zhong Bing Ji Jiu Yi Xue. 2023 Jul;35(7):696-701. doi: 10.3760/cma.j.cn121430-20221219-01104. Zhonghua Wei Zhong Bing Ji Jiu Yi Xue. 2023. PMID: 37545445 Chinese.
-
Artificial intelligence in clinical care amidst COVID-19 pandemic: A systematic review.Comput Struct Biotechnol J. 2021;19:2833-2850. doi: 10.1016/j.csbj.2021.05.010. Epub 2021 May 7. Comput Struct Biotechnol J. 2021. PMID: 34025952 Free PMC article. Review.
-
Machine Learning Models in Sepsis Outcome Prediction for ICU Patients: Integrating Routine Laboratory Tests-A Systematic Review.Biomedicines. 2024 Dec 19;12(12):2892. doi: 10.3390/biomedicines12122892. Biomedicines. 2024. PMID: 39767798 Free PMC article. Review.
Cited by
-
Red cell distribution width and clinical outcomes in sepsis patients infected with Escherichia coli using data from MIMIC-IV.Eur J Med Res. 2025 Jul 5;30(1):580. doi: 10.1186/s40001-025-02756-4. Eur J Med Res. 2025. PMID: 40618111 Free PMC article.
-
The Application of Machine Learning Algorithms to Predict HIV Testing Using Evidence from the 2002-2017 South African Adult Population-Based Surveys: An HIV Testing Predictive Model.Trop Med Infect Dis. 2025 Jun 14;10(6):167. doi: 10.3390/tropicalmed10060167. Trop Med Infect Dis. 2025. PMID: 40559734 Free PMC article.
-
Developing a Predictive Model for Significant Prostate Cancer Detection in Prostatic Biopsies from Seven Clinical Variables: Is Machine Learning Superior to Logistic Regression?Cancers (Basel). 2025 Mar 25;17(7):1101. doi: 10.3390/cancers17071101. Cancers (Basel). 2025. PMID: 40227611 Free PMC article.
References
-
- Raith EP, Udy AA, Bailey M, McGloughlin S, MacIsaac C, Bellomo R, et al. . Prognostic accuracy of the SOFA score, SIRS criteria, and qSOFA score for in-hospital mortality among adults with suspected infection admitted to the intensive care unit. JAMA. (2017) 317:290–300. doi: 10.1001/jama.2016.20328 - DOI - PubMed
LinkOut - more resources
Full Text Sources