. 2025 Jan 6:15:1477781.
doi: 10.3389/fimmu.2024.1477781. eCollection 2024.

The emergence of DNAM-1 as the facilitator of NK cell-mediated killing in ovarian cancer

Affiliations

The emergence of DNAM-1 as the facilitator of NK cell-mediated killing in ovarian cancer

Rachel Pounds et al. Front Immunol. .

Abstract

Introduction: Ovarian cancer (OC) is the sixth most common malignancy in women and the poor 5-year survival emphasises the need for novel therapies. NK cells play an important role in the control of malignant disease but the nature of tumour-infiltrating and peripheral NK cells in OC remains unclear.

Methods: Using flow cytometric analysis, we studied the phenotype and function of NK cells in blood, primary tumour and metastatic tissue in 80 women with OC. The cell type contexture of metastatic OC tissue was explored utilising scRNAseq analysis, with a focus on portraying an immunogenic tumour microenvironment and determining the characteristics of a dysfunctional NK cell population.

Results: The proportion of peripheral NK cells was markedly elevated with a highly activated profile and increased cytotoxicity. In contrast, NK cell numbers in primary tumour and metastasis were substantially reduced, with downregulation of activatory receptors together with elevated PD-1 expression. scRNA-Seq identified 5 NK cell subpopulations along with increased exhausted and immature NK cells within tumour tissue compared to normal tissue. These features were attenuated following chemotherapy where higher levels of activated and cytotoxic NK cells associated with improved disease-free survival. Correlation of NK cell phenotype with clinical outcomes revealed high levels of DNAM-1 expression on tissue-localised and peripheral NK cells to be associated with reduced survival. Expression of PVR, the DNAM-1 ligand, was significantly increased on tumours and DNAM-1 mediated NK cell lysis of primary tumour tissue was observed in vitro.

Discussion: These findings reveal profound modulation of the tumour tissue and systemic profile of NK cells which likely contributes to the high rates of local progression and metastasis seen with OC. Immunotherapeutic approaches that overcome local immune suppression and enhance DNAM-1-targeted lysis of OC offer the potential to improve disease control.

Keywords: DNAM-1; HGSOC; NK cells; cancer immunology; ovarian cancer.


Conflict of interest statement

The authors declare that the research was conducted in the absence of any commercial or financial relationships that could be construed as a potential conflict of interest.

Figures

Figure 1
Figure 1
Patients with OC have an increased proportion of NK cells with activated phenotype within the peripheral blood. The proportion of peripheral blood NK cells (A), percentage of NKp46 expression (B), percentage of CTLA4 expression (C) and percentage of PD-1 expression (D) were compared between patients with OC (chemotherapy-naïve and chemotherapy-exposed combined) and healthy donors (HD) with normal ovaries (Left panels) and between OC patients managed with primary surgery (PS) or treated with neoadjuvant chemotherapy (NACT) and healthy donors (HD) with normal ovaries (Right panels). Data are shown as dot plot (A) or violin plots (B–D) with each dot representing a donor. The significance was determined using Mann-Whitney testing (left panels) and Kruskal-Wallis testing.
Figure 2
Figure 2
Peripheral NK cells in OC patients are cytotoxic but have impaired cytokine secretion. (A) The cytotoxicity of peripheral NK cells enriched from healthy donors (HD), primary surgery (PS) OC patients and neoadjuvant chemotherapy (NACT) OC patients were compared using a flow cytometry based true count assay. Data shown are as dot plots with each dot representing a donor. Whole PBMCs from OC patients and HDs were co-cultured with K562 cells and stained with (B) TNF- α, (C) IFN-γ and (D) IL-2 antibodies. The percentage of NK cells that produce each cytokine was compared between OC patients and HDs. Data is shown as bar charts with each dot representing a donor. The significance was determined using Kruskal-Wallis testing.
Figure 3
Figure 3
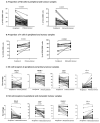
The proportion of infiltrating NK cells within primary and metastatic tumour tissue was reduced and with a less activated phenotype. (A) The percentage of CD3-CD56+ NK cells and (B) the percentage of CD3+CD56- T cells were compared between PBMCs and matched TILs from the same OC patient, displaying comparisons to primary tumour tissue (left panel) and metastatic tumour tissue (right panel). The percentage of NKp46, CD57, DNAM-1 and PD-1 expression on NK cells was compared between PBMCs and TILs from either primary tumour tissue (C) or metastatic tumour tissue (D) from OC patients. Data are shown as dot plots with each dot representing a matched donor. The significance was determined using Wilcoxon test.
Figure 4
Figure 4
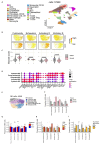
Transcriptional characterisations of NK cells within omental tissue. UMAP embedding of integrated scRNAseq data overlaid with major lineage cell type clusters (A). UMAP embeddings of NK cells overlaid with signature module scores for NK cytotoxicity, exhaustion, activating receptors and inhibitory receptors to identify the function of NK cells (B). The distributions of module scores stratified by tissue type, comparing omental tumour (n=8) and normal omentum (n=1) in patients with HGSOC (C). Dot plot to show the average expression of the top marker genes identified as being overexpressed in different NK subpopulations. The size of the dots indicates the proportion of cells within the cluster that are expressing the given gene (D). UMAP embedding of NK cell populations overlaid with the NK cell subpopulations identified by unsupervised clustering (E). The proportion of NK cell subtypes in omental tumour (n=8) and normal omental tissue (n=1) (F), prior to chemotherapy (PDS cohort) vs following neoadjuvant chemotherapy (NACT cohort) (G) and stratified by Chemotherapy Response Score (CRS). NA = chemotherapy-naïve, primary surgery samples (H). The proportion of NK cell clusters in patients who had disease recurrence 18 months following chemotherapy treatment (1) compared to those that remained disease free (0) (I).
Figure 5
Figure 5
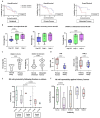
The importance of activating receptor DNAM-1 in Ovarian Cancer. (A) Kaplan-Meier curve (log-rank test) to compare the overall survival of HGSOC patients between two groups according to the percentage of DNAM-1 expression on NK cells (cut-off point as median DNAM-1 expression) from whole PBMCs (left panel), TILs from either primary tumour tissue (middle panel) or metastatic tumour tissue (right panel). (B) Bar charts to compare the percentage of DNAM-1 expression on NK cells from whole PBMCs (left panel), TILs from either primary tumour tissue (middle panel) or metastatic tumour tissue (right panel) from OC patients according to disease stage. Data are shown as bar charts with each dot representing a donor. Significance was determined using Kruskal-Wallis testing. (C) Violin plots to compare the percentage of DNAM-1 expression on NK cells from tissue between normal ovary versus primary ovary tissue (left panel) and normal omental tissue versus metastatic omental tumour tissue (right panel). Data are shown as violin plots with each dot representing a donor. Significance was determined using Mann Whitney testing. (D) Total RNA extracted from OC tissue and benign ovary for Q-PCR to detect the ratio of copy numbers of PVR and PVRL2 to 18s. Data shown as bar charts with each dot representing a donor. Significance determined using Mann Whitney testing. (E) The cytotoxicity against primary OC tissue, benign ovarian tissue or normal ovarian tissue using peripheral NK cells enriched from either HD or autologous PBMCs. Data shown as bar charts with each dot representing a donor. The significance was determined using Mann Whitney testing. (F) Cytotoxicity assay with primary OC tissue and enriched allogenic PBMCs NK cells in the presence of no antibodies, anti-DNAM-1, anti-NKG2D, anti-NKp46 or anti-NKp30 antibodies. Data are shown as bar charts with each dot representing a donor. Significance was determined using Mann Whitney testing.

Similar articles

References

    1. 2024 OVARIAN CANCER KEY STATS. Available online at: https://worldovariancancercoalition.org/about-ovarian-cancer/key-stats/ (Accessed August 6, 2024).
    1. 2024 Ovarian cancer statistics. Available online at: https://www.cancerresearchuk.org/health-professional/cancer-statistics/s... (Accessed August 6, 2024).
    1. Manchanda R, Abdelraheim A, Johnson M, Rosenthal AN, Benjamin E, Brunell C, et al. . Outcome of risk-reducing salpingo-oophorectomy in BRCA carriers and women of unknown mutation status. Bjog. (2011) 118:814–24. doi: 10.1111/j.1471-0528.2011.02920.x - DOI - PubMed
    1. Network CGAR. Integrated genomic analyses of ovarian carcinoma. Nature. (2011) 474:609–15. doi: 10.1038/nature10166 - DOI - PMC - PubMed
    1. Lynch HT, Snyder C, Casey MJ. Hereditary ovarian and breast cancer: what have we learned? Ann Oncol. (2013) 24 Suppl 8:viii83–95. doi: 10.1093/annonc/mdt313 - DOI - PubMed

MeSH terms

Substances