. 2025 Jan 6:15:1511866.
doi: 10.3389/fimmu.2024.1511866. eCollection 2024.

The global trends and distribution in tumor-infiltrating lymphocytes over the past 49 years: bibliometric and visualized analysis

Affiliations

The global trends and distribution in tumor-infiltrating lymphocytes over the past 49 years: bibliometric and visualized analysis

Beibei Wu et al. Front Immunol. .

Abstract

Background: The body of research on tumor-infiltrating lymphocytes (TILs) is expanding rapidly; yet, a comprehensive analysis of related publications has been notably absent.

Objective: This study utilizes bibliometric methodologies to identify emerging research hotspots and to map the distribution of tumor-infiltrating lymphocyte research.

Methods: Literature from the Web of Science database was analyzed and visualized using VOSviewer, CiteSpace, Scimago Graphica, R-bibliometrix, and R packages.

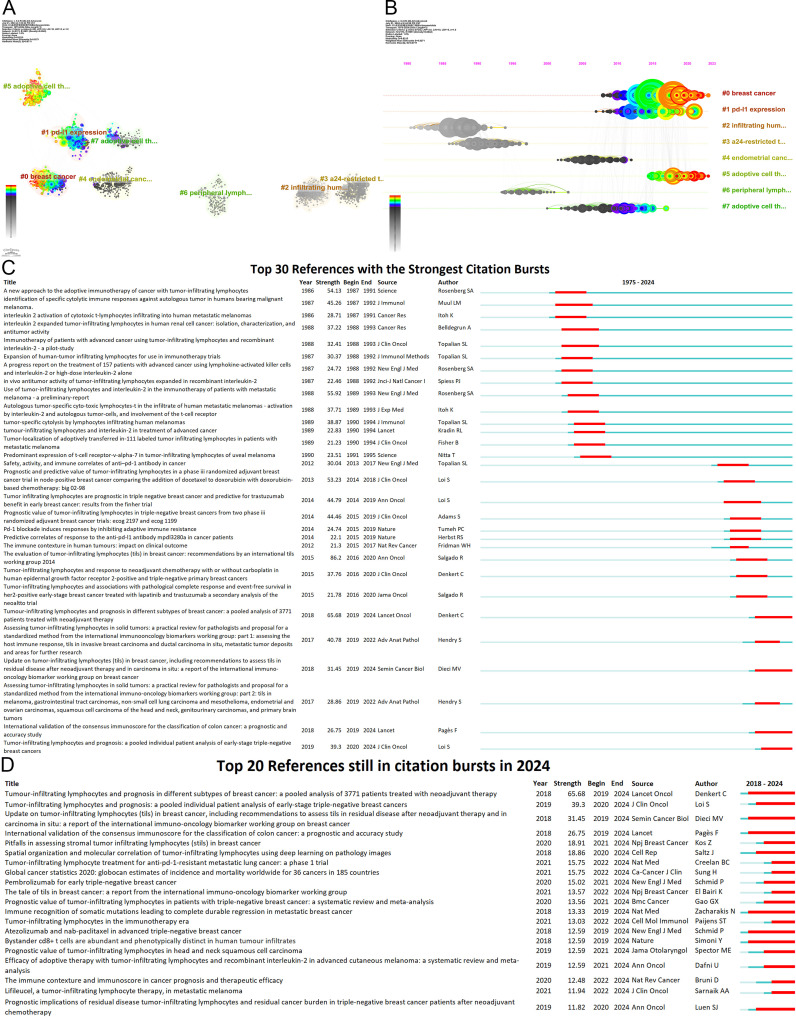
Results: Research on tumor-infiltrating lymphocytes began in 1975 and has experienced significant growth, particularly after 2015. Leading contributors include the United States, the National Cancer Institute, the journal Cancer Immunology Immunotherapy, and researcher Steven A. Rosenberg. Other prominent contributors include China, the National Institutes of Health, researcher Roberto Salgado, and the Journal of Immunology. Prominent institutions in the USA and Europe occupy central roles within collaborative networks. Financial support plays a pivotal role in driving research advancements. Keyword clustering analysis reveals four primary knowledge domains: adoptive cell therapy; the prognostic value of TILs; PD-1/PD-L1 and TILs; and prognostic studies of TILs across various cancers. Keyword and reference analyses further indicate that "adoptive cell therapy," "the prognostic value of TILs," and "immune checkpoint inhibitors and TILs" are central themes in current and future research. Combination therapies; tumor neoantigens; gene editing; dominant population selection of TILs therapy; TILs in Tumor microenvironment; emerging predictive biomarkers; TILs in predicting the efficacy of neoadjuvant chemotherapy and immunotherapy; the relationship between TILs and PD-L1; TIL-based patient stratification; tertiary lymphoid structures; and TIL evaluation through digital pathology and artificial intelligence are identified as key areas of interest.

Conclusions: This analysis highlights the increasing academic focus on tumor-infiltrating lymphocyte research and identifies key recent themes in the field such as prognostic value of TILs, personalized treatments, and combination therapies.

Keywords: PD-L1; adoptive cell therapy; bibliometrics; predictive biomarker; tumor-infiltrating lymphocytes.


Conflict of interest statement

The authors declare that the research was conducted in the absence of any commercial or financial relationships that could be construed as a potential conflict of interest.

Figures

Figure 1
Figure 1
Annual trends of global publications.
Figure 2
Figure 2
Analysis of countries. (A) A world map displaying the total publications from the top 30 countries/regions. The circle size represents the volume of publications, while the circle color indicates the volume of citations. The line thickness denotes the strength of collaboration. (B) Number of documents from corresponding authors’ countries. SCP: Single Country Publications, MCP: Multiple Country Publications. (C) Term contributions of the USA in TILs research. Each node represents a term, with the color denoting the frequency in articles from the USA relative to its overall frequency. The closer the color is to red, the higher the proportion. The larger and redder the node, the more prominent the role of the USA in global research pertaining to that term. (D) Term contributions of China in TILs research. (E) Term contributions of Japan in TILs research. (F) Term contributions of Italy in TILs research.
Figure 3
Figure 3
Analysis of Institutions. (A) Term contributions of the NCI in TILs research. (B) Institutional collaboration network. Each node represents an institution, with the node’s size reflecting the institution’s publication volume. Concentric circles around each node represent the number of publications by the institution in different years, with circle colors indicating various years. Wider circles denote higher publication volumes for the respective years. Lines connecting nodes represent collaborative relationships between institutions. The graph’s interpretation can be enhanced by considering both the size and color of the nodes. (C) The bursts analysis of institutional publication. “Strength” denotes the intensity of keyword bursts, while “year” indicates the initial appearance of the institution, as indicated by the dark blue band. “Begin” and “End” mark the start and end of the burst period, respectively, with the red band highlighting the duration of the burst. (D) Annual publication volumes for the top 30 institutions. The colors represent publication volume, with brighter colors indicating higher publication volume.
Figure 4
Figure 4
Analysis of authors. (A) Annual publication volumes for the top 30 authors. The colors represent publication volume, with brighter colors indicating higher publication volume. (B) The bursts analysis of authors’ publication. (C) Collaboration network of authors.
Figure 5
Figure 5
Analysis of journals. (A) Co-occurrence network of the journal. Nodes represent journals, with their size reflecting frequency. The timeline in the bottom right corner elucidates not the inaugural emergence of journals but rather their mean occurrence chronology. (B) Core Sources by Bradford’s Law. (C) Annual publication volumes for the top 30 journals. (D)Co-occurrence network of journal-keyword. Nodes represent either keywords or journals (identified by an uppercase “J” preceding the journal names). Links signify their correlation within the co-occurrence network, facilitating the exploration of thematic domains covered by the journals. The keywords in this figure consist solely of author keywords. (E) Map of co-cited journals. Each node represents a co-cited journal, node size corresponds to the number of co-citations, links indicate shared co-citations among journals, and colors indicate different clusters of co-cited journals. (F) The Overlay Maps of journals. On the left is the citing graph, and on the right is the cited graph. The curves represent citation links. In the left graph, the longer the horizontal axis of the ellipse, the more papers published in the journal; the longer the vertical axis, the more authors involved. A knowledge flow analysis revealed the evolutionary relationships between citing and cited journals.
Figure 6
Figure 6
(A) The top 15 funding sources in TILs research. (B) The annual proportion of articles with funding in TILs research.
Figure 7
Figure 7
Analysis of keywords. (A) Keywords clustering. Keywords with frequencies exceeding 5 are clustered. Nodes represent keywords, with their size reflecting frequency. Lines denote connections between keywords. Colors indicate different keyword clusters. (B) Timeline view of keywords. The timeline elucidates not the inaugural emergence of keywords but rather their mean occurrence chronology. (C) Trend Topics from 1975 to 2024. (D) Top 100 keywords with the strongest citation bursts from 1975 to 2024. (E) Keywords still in citation bursts in 2024.
Figure 8
Figure 8
Analysis of references (A) Co-cited literature cluster in the TILs domain from 1975 to 2024. The average appearance time of the cluster is indicated in the lower-left corner. The transition from cooler to warmer color gradients visually depicts knowledge flow among these clusters. (B) Timeline View of co-cited literature Cluster. Each horizontal line is labeled with a cluster tag on its far right end. The size of nodes is proportional to the number of references, and the date of paper publication is indicated at the top of the figure. (C) Top 30 references with the strongest co-citation bursts from 1975 to 2024. The blue line represents the timeline spanning from 2008 to 2023, while the red line marks the specific time when each citation burst occurred. (D) Top 20 References still in citation bursts in 2024.

Similar articles

References

    1. Binnewies M, Roberts EW, Kersten K, Chan V, Fearon DF, Merad M, et al. . Understanding the tumor immune microenvironment (Time) for effective therapy. Nat Med. (2018) 24:541–50. doi: 10.1038/s41591-018-0014-x - DOI - PMC - PubMed
    1. Paijens ST, Vledder A, De Bruyn M, Nijman HW. Tumor-infiltrating lymphocytes in the immunotherapy era. Cell Mol Immunol. (2021) 18:842–59. doi: 10.1038/s41423-020-00565-9 - DOI - PMC - PubMed
    1. Rosenberg SA, Packard BS, Aebersold PM, Solomon D, Topalian SL, Toy ST, et al. . Use of tumor-infiltrating lymphocytes and interleukin-2 in the immunotherapy of patients with metastatic melanoma. A preliminary report. N Engl J Med. (1988) 319:1676–80. doi: 10.1056/NEJM198812223192527 - DOI - PubMed
    1. Rosenberg SA, Yannelli JR, Yang JC, Topalian SL, Schwartzentruber DJ, Weber JS, et al. . Treatment of patients with metastatic melanoma with autologous tumor-infiltrating lymphocytes and interleukin-2. J Of Natl Cancer Institute. (1994) 86:1159–66. doi: 10.1093/jnci/86.15.1159 - DOI - PubMed
    1. Lowery FJ, Krishna S, Yossef R, Parikh NB, Chatani PD, Zacharakis N, et al. . Molecular signatures of antitumor neoantigen-reactive T cells from metastatic human cancers. Science. (2022) 375:877–84. doi: 10.1126/science.abl5447 - DOI - PMC - PubMed