. 2025 Jan 6:15:1511998.
doi: 10.3389/fphys.2024.1511998. eCollection 2024.

Detection of respiratory frequency rhythm in human alpha phase shifts: topographic distributions in wake and drowsy states

Affiliations

Detection of respiratory frequency rhythm in human alpha phase shifts: topographic distributions in wake and drowsy states

Aleksandar Kalauzi et al. Front Physiol. .

Abstract

Introduction: The relationship between brain activity and respiration is recently attracting increasing attention, despite being studied for a long time. Respiratory modulation was evidenced in both single-cell activity and field potentials. Among EEG and intracranial measurements, the effect of respiration was prevailingly studied on amplitude/power in all frequency bands.

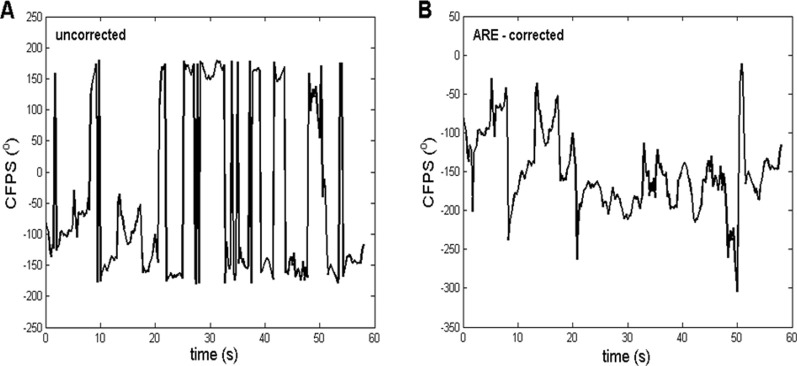
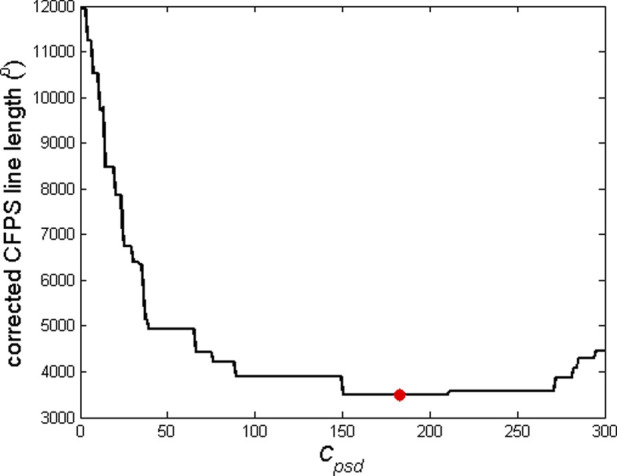
Methods: Since phases of EEG oscillations received less attention, we applied our previously published carrier frequency (CF) mathematical model of human alpha oscillations on a group of 10 young healthy participants in wake and drowsy states, using a 14-channel average reference montage. Since our approach allows for a more precise calculation of CF phase shifts (CFPS) than any individual Fourier component, by using a 2-s moving Fourier window, we validated the new method and studied, for the first time, temporal waveforms CFPS(t) and their oscillatory content through FFT (CFPS(t)).

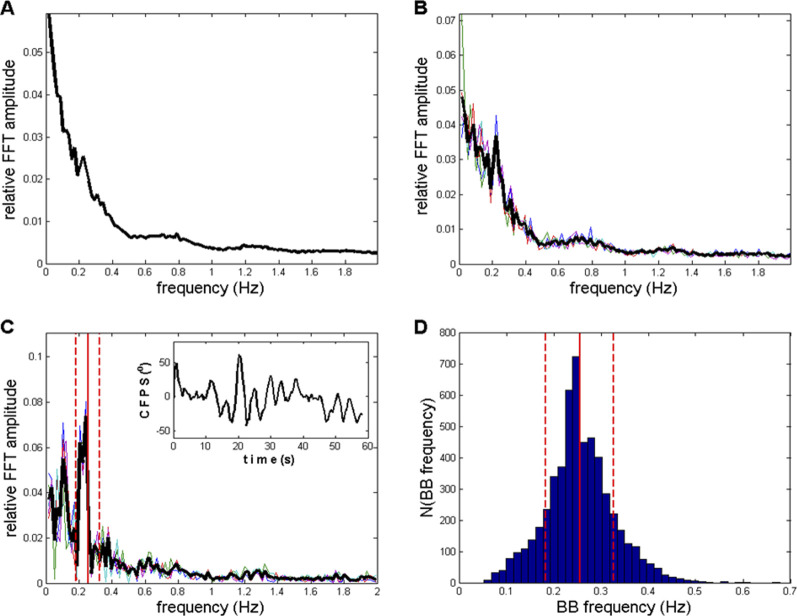
Results: Although not appearing equally in all channel pairs and every subject, a clear peak in the respiratory frequency region, 0.21-0.26 Hz, was observed (max at 0.22 Hz). When five channel pairs with the most prominent group averaged amplitudes at 0.22 Hz were plotted in both states, topographic distributions changed significantly-from longitudinal, connecting frontal and posterior channels in the wake state to topographically split two separate regions-frontal and posterior in the drowsy state. In addition, in the drowsy state, 0.22-Hz amplitudes decreased for all pairs, while statistically significant reduction was obtained for 20/91 (22%) pairs.

Discussion: These results potentially evidence, for the first time, the respiratory frequency modulation of alpha phase shifts, as well as the significant impact of wakeful consciousness on the observed oscillations.

Keywords: alpha activity; electroencephalography; mind–body interaction; phase shift; respiration; wake and drowsy.


Conflict of interest statement

The author(s) declared that they were an editorial board member of Frontiers, at the time of submission. This had no impact on the peer review process and the final decision.

Figures

FIGURE 1
FIGURE 1
Representative example of the ARE method, in which the procedure, applied on the CFPS(t) waveform, had a substantial effect. (A) Uncorrected, derived from subject one between channels T3 and O2, where a contra-phase was present (CFPS values grouped approximately ±180°). (B) Corrected after applying the ARE procedure, where most of the “abrupt jumps” were eliminated, making it more suitable for further FFT analysis. The contra-phase is present usually when fronto-occipital or temporo-occipital pairs are being analyzed.
FIGURE 2
FIGURE 2
Example of dependence of the corrected CFPS line length on the critical phase shift difference, C psd . Optimal C psd , above which the ARE procedure is to be applied, corresponds to the minimal CFPS line length and is marked with a red dot. This example refers to the CFPS waveform presented in Figure 1A to produce the corrected waveform shown in Figure 1B.
FIGURE 3
FIGURE 3
Two representative examples of relative amplitudes of CFPS(t) FFT spectra. Profiles are similar, exhibiting different individual oscillations superimposed on an fGn + fBm type noisy background. (A) Channel pair F8, T4 recorded in subject 7. (B) Channel pair F8, O2 is recorded in subject 9.
FIGURE 4
FIGURE 4
(A) Histogram of all 910 β-values (91 channel pairs × 10 subjects) calculated according to Equation 7. (B) Histogram of 91 β-values calculated for each channel pair by averaging the values across the group of 10 subjects, according to Equation 8. Vertical red lines mark the mean β.
FIGURE 5
FIGURE 5
(A) Dependence of exponent β (Equation 7) on the relative amplitude attenuation factor k a (Equation 9) for 20 repeatedly generated white noise and 20 Brownian motion signals. Thin lines represent 400 of these repetitions, whereas the thick black line represents their average. (B) Average (solid) ± standard deviation (dashed) of the same set of lines as shown in panel (A). Mean β (1.6596), from the histogram shown in Figure 4A, is plotted as a thin horizontal line in order to determine the corresponding k a value (≈0.92) to be used in the CFPS(t) background simulation.
FIGURE 6
FIGURE 6
Comparison between recorded and simulated CFPS(t) background activities in the time domain. (A) Recorded from subject 1: channels F8, T4. (B) Simulation containing Wn and Bm, with k a = 0.92. (C) Simulation with k a = 0.5. (D) Relative amplitude FFT spectra of 400 repeated simulations generated using k a = 0.92. Thin colored lines represent individual simulations, whereas the thick black line represents their average.
FIGURE 7
FIGURE 7
(A) Representative example of a relative amplitude spectrum of recorded CFPS(t) activity, with pronounced individual oscillations superimposed on the background, obtained from subject 9, between channels O1 and O2. (B) Simulation of the activity shown in A, consisting of a fGn + fBm (represented by Wn + Bm) fractal background, with k a = 0.92 and summed with a 0.22-Hz artificial sinewave.
FIGURE 8
FIGURE 8
(A) Simulation of a typical CFPS(t) waveform, containing two fractal background components, Wn and Bm, and a 0.22-Hz sinewave. The simulation served as the input to the procedure of calculating CFPS(t), which is part of the steps a)–e) in Section 2.4. (B) Output from the CFPS procedure, having a high correlation with the input (r = 0.9421). Inlet: input–output waveforms superimposed.
FIGURE 9
FIGURE 9
(A) Average of all 910 (10 subjects x 91 channel pairs) FFT CFPS(t) spectra according to Equation 10; no selection applied. A peak at the 13th FC (0.2232 Hz) is small but visible. (B) Average of five spectra, previously averaged across 10 subjects (Equation 11), selected to have maximal sum of relative amplitudes between 12th and 15th FCs (0.2060–0.2575 Hz). The same peak appeared, with an increased S/N ratio compared to the ratio in panel (A). (C) Average of five spectra, with no previous group averaging (i.e., directly from the pool of 910 spectra), again characterized by the maximal sum of relative amplitudes between 12th and 15th FCs. Main peaks were in the range of 0.2060–0.2403 Hz, as well as one appearing at sixth FC (0.1030 Hz). Inlet: an example of recorded CFPS(t), subject 9, channels O1 and O2, where respiratory frequency oscillation could be noticed by the naked eye. (D) Histogram of 5450 BB (breath-to-breath) frequencies recorded from 20 healthy subjects in the supine position. Vertical red lines, with mean ± st. dev., also drawn in panel (C). Thin colored lines in panels (B, C) originate from five individual spectra, whereas the thick black line represents their average.
FIGURE 10
FIGURE 10
Topographic view of the selection of five channel pairs with a maximal group average of relative FFT amplitudes in the wake state, according to Equation 11. (A) Channel pairs with the maximal sum of four relative amplitudes (12th–15th FCs), corresponding to the frequency range of 0.2060–0.2575 Hz. (B) Analogous topography shown in panel A drawn for one (13th FC) at a frequency of 0.2232 Hz. (C) Relative FFT amplitudes for all 91 channel pairs (Equation 11) plotted in the descending order. Ordinates of the red line (representing one FC) were taken from Table 2 and multiplied by four to make them comparable to the blue line (corresponding to summed amplitudes of 4 FCs). The first five channel pairs of the red line are marked with black circles because they correspond to the pairs plotted in panel (B). Their abrupt decrease explains why we chose five pairs for the topographic presentation. For the sake of clarity, error bars were omitted.
FIGURE 11
FIGURE 11
(AC) Spectra corresponding to those shown in Figures 9A–C, but here, they refer to the drowsy state. (A) CFPS oscillation peaks in the low-frequency region f < 0.5 Hz are reduced or even diminished compared to the wake state, as shown in Figure 9A. (B) After averaging across the 10 subjects, in five selected spectra, a reduced 13th FC (0.2232 Hz) peak appeared in the drowsy state as well. (C) The sixth FC peak at 0.1030 Hz, which was present in the wake state shown in Figure 9C, disappeared in the drowsy state. (D) Averaged spectra from Figures 9C, 11C are superimposed so that they can be directly compared.
FIGURE 12
FIGURE 12
(A, B) Same topographic distribution of five channel pairs is shown in Figures 10A, B, obtained for the drowsy state. As shown in the wake state, the two distributions are mutually similar but differ significantly from the distributions in the wake state. (C) Relative FFT amplitudes for all 91 channel pairs (Equation 11) plotted in the descending order, superimposed for the wake (w) and drowsy (d) states and for two frequency regions (13th and 12th – 15th FCs). As shown in Figure 10C, ordinates of the brown line (one FC) were multiplied by four to be comparable to the black line (summed amplitudes of 4 FCs). For all channel pairs, amplitudes in the drowsy state are smaller than those in the wake state, pointing to the fact that wakefulness is necessary for the respiratory frequency alpha CFPS to be present in full capacity across the whole scalp.
FIGURE 13
FIGURE 13
Topographic distribution of channel pairs which had significantly greater (p < 0.05) relative FFT amplitudes of CFPS(t) oscillations at 0.2232 Hz in the wake state than those in the drowsy state.

Similar articles

Cited by

References

    1. Abdalbari H., Durrani M., Pancholi S., Patel N., Nasuto S. J., Nicolaou N. (2022). Brain and brain-heart Granger causality during wakefulness and sleep. Front. Neurosci. 16, 927111. 10.3389/fnins.2022.927111 - DOI - PMC - PubMed
    1. Bai X., Li J., Zhou L., Li X. (2009). Influence of the menstrual cycle on nonlinear properties of heart rate variability in young women. Am. J. Physiol. Heart Circ. Physiol. 297 (2), H765–H774. 10.1152/ajpheart.01283.2008 - DOI - PubMed
    1. Berger A. J., Averill D. B. (1983). Projection of single pulmonary stretch receptors to solitary tract region. J. Neurophysiol. 49 (3), 819–830. 10.1152/jn.1983.49.3.819 - DOI - PubMed
    1. Berger B., Minarik T., Liuzzi G., Hummel F. C., Sauseng P. (2014). EEG oscillatory phase‐dependent markers of corticospinal excitability in the resting brain. Biomed. Res. Int. 2014 (1), 936096. 10.1155/2014/936096 - DOI - PMC - PubMed
    1. Bing-Canar H., Pizzuto J., Compton R. J. (2016). Mindfulness-of-breathing exercise modulates EEG alpha activity during cognitive performance. Psychophysiology 53, 1366–1376. 10.1111/psyp.12678 - DOI - PubMed

LinkOut - more resources