Interaction between breastfeeding duration and an obesity genetic risk score to predict body fat composition in European adolescents: The HELENA study
- PMID: 39835382
- PMCID: PMC11803183
- DOI: 10.1111/ijpo.13205
Interaction between breastfeeding duration and an obesity genetic risk score to predict body fat composition in European adolescents: The HELENA study
Abstract
Background: Although the genetic interplay with the environment has a major impact on obesity development, little is known on whether breastfeeding could modulate the genetic predisposition to obesity.
Objectives: To investigate whether breastfeeding attenuates the effect of an obesity genetic risk score (GRS) on adiposity in European adolescents.
Methods: Totally 751 adolescents from the Healthy Lifestyle in Europe by Nutrition in Adolescence (HELENA) cross-sectional study were included, divided according to breastfeeding status into never breastfed, 1-3 months and ≥4 months. Adjusting by socioeconomic status and lifestyle factors multiple linear regression models were used to assess (1) the main effect of breastfeeding duration and (2) its interaction effect with an obesity GRS, to predict different adiposity measures.
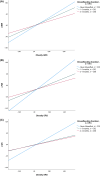
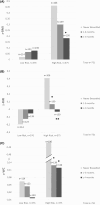
Results: A significant negative association between ≥4 months of breastfeeding and waist circumference (WC) z-score was observed [β (95% confidence interval), p-value] = [β = -0.189 (-0.37, -0.00), p = 0.044]. Also, significant interaction effects were observed for 1-3 and ≥4 months of breastfeeding and obesity GRS regarding body mass index (BMI) z-score [β = 0.155 (0.06, 0.24), p = 0.001] and [β = 0.108 (0.01, 0.18), p = 0.020, respectively] and fat mass index (FMI) z-score [β = 0.134 (0.04, 0.22), p = 0.003] and [β = 0.100 (0.01, 0.18), p = 0.026, respectively].
Conclusions: Breastfeeding modulates the association between the obesity GRS and body composition in adolescents.
Keywords: HELENA; adolescents; breastfeeding; genetic risk score; interaction effect; obesity.
© 2025 The Author(s). Pediatric Obesity published by John Wiley & Sons Ltd on behalf of World Obesity Federation.
Conflict of interest statement
The authors declare no conflict of interest. The funders had no role in the design of the study; in the collection, analyses or interpretation of data; in the writing of the manuscript, or in the decision to publish the results. The content of this article reflects the authors' views alone, and the European Community is not liable for any use that may be made of the information contained herein.
Figures


References
-
- World Health Organization (WHO) . Obesity and overweight. Accessed May 16, 2023. https://www.who.int/news-room/fact-sheets/detail/obesity-and-overweight
MeSH terms
Grants and funding
- PI20/00988/Health Institute Carlos III (ISCIII)
- FOODCT-2005-007034/European Community Sixth RTD Framework Programme
- 801586/the Iberus Talent Pre-doctoral fellowships 2018, under the European Union's H2020 research and innovation programme under Marie Sklodowska-Curie
- the University of Zaragoza-Mecenazgo Santander

