

The Role of Proton Magnetic Resonance Spectroscopy in Neonatal and Fetal Brain Research
- PMID: 39835523
- PMCID: PMC12063769
- DOI: 10.1002/jmri.29709
The Role of Proton Magnetic Resonance Spectroscopy in Neonatal and Fetal Brain Research
Abstract
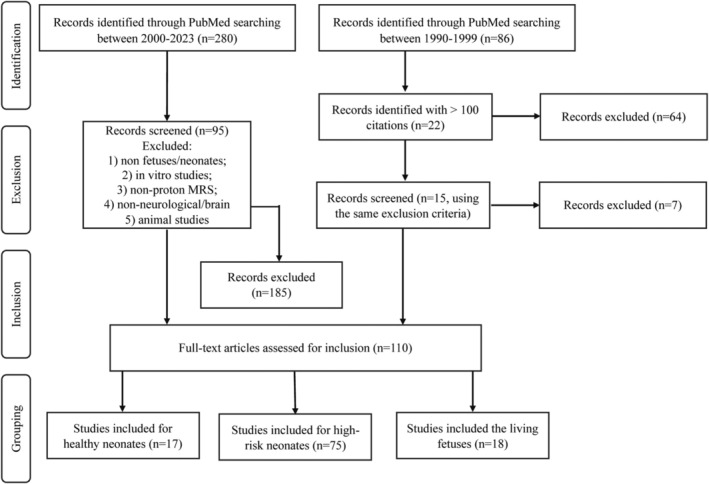
The biochemical composition and structure of the brain are in a rapid change during the exuberant stage of fetal and neonatal development. 1H-MRS is a noninvasive tool that can evaluate brain metabolites in healthy fetuses and infants as well as those with neurological diseases. This review aims to provide readers with an understanding of 1) the basic principles and technical considerations relevant to 1H-MRS in the fetal-neonatal brain and 2) the role of 1H-MRS in early fetal-neonatal development brain research. We performed a PubMed search to identify original studies using 1H-MRS in neonates and fetuses to establish the clinical applications of 1H-MRS. The eligible studies for this review included original research with 1H-MRS applications to the fetal-neonatal brain in healthy and high-risk conditions. We ran our search between 2000 and 2023, then added in several high-impact landmark publications from the 1990s. A total of 366 results appeared. After, we excluded original studies that did not include fetuses or neonates, non-proton MRS and non-neurological studies. Eventually, 110 studies were included in this literature review. Overall, the function of 1H-MRS in healthy fetal-neonatal brain studies focuses on measuring the change of metabolite concentrations during neurodevelopment and the physical properties of the metabolites such as T1/T2 relaxation times. For high-risk neonates, studies in very low birth weight preterm infants and full-term neonates with hypoxic-ischemic encephalopathy, along with examining the associations between brain biochemistry and cognitive neurodevelopment are most common. Additional high-risk conditions included infants with congenital heart disease or metabolic diseases, as well as fetuses of pregnant women with hypertensive disorders were of specific interest to researchers using 1H-MRS. EVIDENCE LEVEL: 1 TECHNICAL EFFICACY: Stage 2.
Keywords: brain; fetuses; metabolites; neonates; proton magnetic resonance spectroscopy.
© 2025 The Author(s). Journal of Magnetic Resonance Imaging published by Wiley Periodicals LLC on behalf of International Society for Magnetic Resonance in Medicine.
Conflict of interest statement
The authors declare no conflicts of interest.
Figures
Similar articles
-
Brain proton magnetic resonance spectroscopy and neurodevelopment after preterm birth: a systematic review.Pediatr Res. 2022 May;91(6):1322-1333. doi: 10.1038/s41390-021-01539-x. Epub 2021 May 5. Pediatr Res. 2022. PMID: 33953356
-
Non-invasive measurement of biochemical profiles in the healthy fetal brain.Neuroimage. 2020 Oct 1;219:117016. doi: 10.1016/j.neuroimage.2020.117016. Epub 2020 Jun 8. Neuroimage. 2020. PMID: 32526384 Free PMC article.
-
1H-MR Spectroscopy of the Early Developmental Brain, Neonatal Encephalopathies, and Neurometabolic Disorders.Magn Reson Med Sci. 2022 Mar 1;21(1):9-28. doi: 10.2463/mrms.rev.2021-0055. Epub 2021 Aug 21. Magn Reson Med Sci. 2022. PMID: 34421092 Free PMC article.
-
Brain Metabolite Differences in Fetuses With Cytomegalovirus Infection: A Magnetic Resonance Spectroscopy Study.J Magn Reson Imaging. 2025 Mar;61(3):1133-1141. doi: 10.1002/jmri.29507. Epub 2024 Jul 9. J Magn Reson Imaging. 2025. PMID: 38979886 Free PMC article.
-
MR spectroscopy in children: protocols and pitfalls in non-tumorous brain pathology.Pediatr Radiol. 2016 Jun;46(7):963-82. doi: 10.1007/s00247-014-3270-z. Epub 2016 May 27. Pediatr Radiol. 2016. PMID: 27233789 Review.
References
-
- de Graaf RA. In vivo NMR spectroscopy – Static aspects. In Vivo NMR Spectroscopy. Hoboken, New Jersey: John Wiley & Sons; 2019. p 43‐128.
Publication types
MeSH terms
Grants and funding
LinkOut - more resources
Full Text Sources
Miscellaneous
