Extracellular Mitochondrial-Derived Vesicles Affect the Progression of Diabetic Foot Ulcer by Regulating Oxidative Stress and Mitochondrial Dysfunction
- PMID: 39835574
- PMCID: PMC11904950
- DOI: 10.1002/advs.202407574
Extracellular Mitochondrial-Derived Vesicles Affect the Progression of Diabetic Foot Ulcer by Regulating Oxidative Stress and Mitochondrial Dysfunction
Abstract
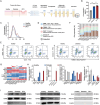
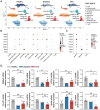
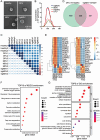
Diabetic foot ulcer (DFU) is a common and severe complication of diabetes mellitus, the etiology of which remains insufficiently understood, particularly regarding the involvement of extracellular vesicles (EVs). In this study, nanoflow cytometry to detect EVs in DFU skin tissues is used and found a significant increase in the Translocase of Outer Mitochondrial Membrane 20 (TOM20)+ mitochondrial-derived vesicles (MDVs). The role of MDVs in DFU is yet to be reported. Using single-cell datasets, it is discovered that the increase in MDVs may be regulated by Sorting Nexin 9 (SNX9). In vitro experiments revealed that MDVs secreted by fibroblasts cultured in high glucose medium exhibited similar composition and protein enrichment results to those in DFU tissues, suggesting their potential as an ideal in vitro surrogate. These MDVs promoted apoptosis and intracellular oxidative stress, disrupted mitochondrial structure, and reduced aerobic metabolism in target cells. In vivo experiments also showed that MDV drops hindered wound healing in diabetic mice; however, this effect is rescued by SNX9 inhibitors, restoring mitochondrial dynamics and balance. Under high glucose conditions, MDVs significantly upregulated oxidative stress levels and induced mitochondrial dysfunction. This study proposes targeting MDVs as a potential therapeutic strategy for DFU.
Keywords: diabetic foot ulcers; extracellular vesicles; mitochondria; mitochondrial‐derived vesicles; oxidative stress.
© 2025 The Author(s). Advanced Science published by Wiley‐VCH GmbH.
Conflict of interest statement
The authors declare no conflict of interest.
Figures


Similar articles
-
In vitro study on the promotion of osteogenic differentiation by mitochondrial-derived vesicles through activation of inflammation and reprogramming of metabolic pathways.J Orthop Surg Res. 2025 Apr 17;20(1):388. doi: 10.1186/s13018-025-05749-5. J Orthop Surg Res. 2025. PMID: 40247396 Free PMC article.
-
Metrnl Ameliorates Ferroptosis in Model of Diabetic Foot Ulcer Through the Inhibition of Mitochondrial Damage via LKB1/AMPK Signaling.Exp Clin Endocrinol Diabetes. 2025 Mar;133(3):120-132. doi: 10.1055/a-2502-8712. Epub 2025 Mar 12. Exp Clin Endocrinol Diabetes. 2025. PMID: 40073879
-
Dang-Gui-Si-Ni decoction facilitates wound healing in diabetic foot ulcers by regulating expression of AGEs/RAGE/TGF-β/Smad2/3.Arch Dermatol Res. 2024 Jun 7;316(7):338. doi: 10.1007/s00403-024-03021-0. Arch Dermatol Res. 2024. PMID: 38847916
-
Mitochondria break free: Mitochondria-derived vesicles in aging and associated conditions.Ageing Res Rev. 2024 Dec;102:102549. doi: 10.1016/j.arr.2024.102549. Epub 2024 Oct 19. Ageing Res Rev. 2024. PMID: 39427885 Review.
-
Mitochondria-derived vesicles: A promising and potential target for tumour therapy.Clin Transl Med. 2025 May;15(5):e70320. doi: 10.1002/ctm2.70320. Clin Transl Med. 2025. PMID: 40356246 Free PMC article. Review.
Cited by
-
A sprayable exosome-loaded hydrogel with controlled release and multifunctional synergistic effects for diabetic wound healing.Mater Today Bio. 2025 Aug 5;34:102159. doi: 10.1016/j.mtbio.2025.102159. eCollection 2025 Oct. Mater Today Bio. 2025. PMID: 40822934 Free PMC article.
-
In vitro study on the promotion of osteogenic differentiation by mitochondrial-derived vesicles through activation of inflammation and reprogramming of metabolic pathways.J Orthop Surg Res. 2025 Apr 17;20(1):388. doi: 10.1186/s13018-025-05749-5. J Orthop Surg Res. 2025. PMID: 40247396 Free PMC article.
-
AhR deficiency exacerbates inflammation in diabetic wounds via impaired mitophagy and cGAS-STING-NLRP3 activation: Therapeutic potential of hydrogels loaded with FICZ.Mater Today Bio. 2025 Jul 19;34:102119. doi: 10.1016/j.mtbio.2025.102119. eCollection 2025 Oct. Mater Today Bio. 2025. PMID: 40755898 Free PMC article.
-
Extracellular Vesicles and Their Role in Skin Inflammatory Diseases: From Pathogenesis to Therapy.Int J Mol Sci. 2025 Apr 18;26(8):3827. doi: 10.3390/ijms26083827. Int J Mol Sci. 2025. PMID: 40332512 Free PMC article. Review.
References
MeSH terms
Grants and funding
- 82372526/National Natural Science Foundation of China
- 82302797/National Natural Science Foundation of China
- 32271181/National Natural Science Foundation of China
- 82300018/National Natural Science Foundation of China
- 82102332/National Natural Science Foundation of China
- 2022YFB4600600/National Key R&D Program of China
- 2021M701620/China Postdoctoral Science Foundation
- 2024A1515011230/Guangdong Basic and Applied Basic Research Foundation
- 2023A1515012970/Guangdong Basic and Applied Basic Research Foundation
- 2020B1515120001/Guangdong Basic and Applied Basic Research Foundation
- 2021A1515111074/Guangdong Basic and Applied Basic Research Foundation
- 2018KJYZ005/Science and Technology Innovation Project of Guangdong Province
- 20232007/Scientific research project of Traditional Chinese Medicine Bureau of Guangdong Province
- 21624220/Fundamental Research Funds for the Central Universities
- A20231001/Research Foundation of YunFu People's Hospital
- 2022B004/Yunfu Medical and Health Research Project
LinkOut - more resources
Full Text Sources
Medical
