. 2025 Jan;15(1):e70176.
doi: 10.1002/ctm2.70176.

Annexin A8 deficiency delays atherosclerosis progression

Affiliations

Annexin A8 deficiency delays atherosclerosis progression

Carmen Gutiérrez-Muñoz et al. Clin Transl Med. 2025 Jan.

Abstract

Background: Atherosclerosis is a chronic inflammatory disease characterized by the accumulation of lipids and leukocytes within the arterial wall. By studying the aortic transcriptome of atherosclerosis-prone apolipoprotein E (ApoE-/-) mice, we aimed to identify novel players in the progression of atherosclerosis.

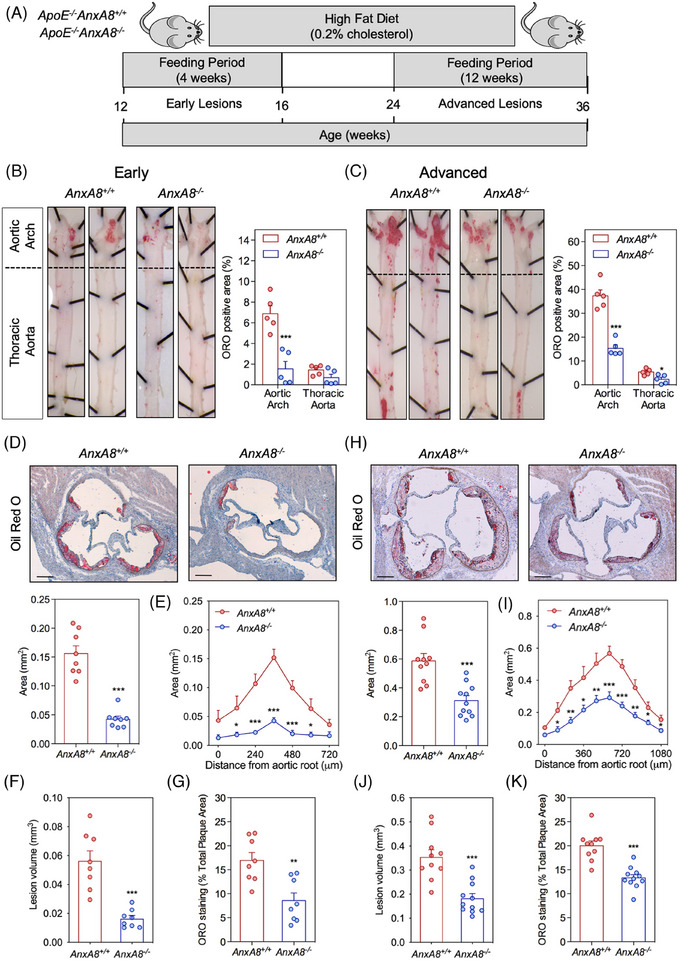
Methods: RNA-Seq analysis was performed on aortas from ApoE-/- and wild-type mice. AnxA8 expression was assessed in human and mice atherosclerotic tissue and healthy aorta. ApoE-/- mice lacking systemic AnxA8 (ApoE-/-AnxA8-/-) were generated to assess the effect of AnxA8 deficiency on atherosclerosis. Bone marrow transplantation (BMT) was also performed to generate ApoE-/- lacking AnxA8 specifically in bone marrow-derived cells. Endothelial-specific AnxA8 silencing in vivo was performed in ApoE-/- mice. The functional role of AnxA8 was analysed in cultured murine cells.

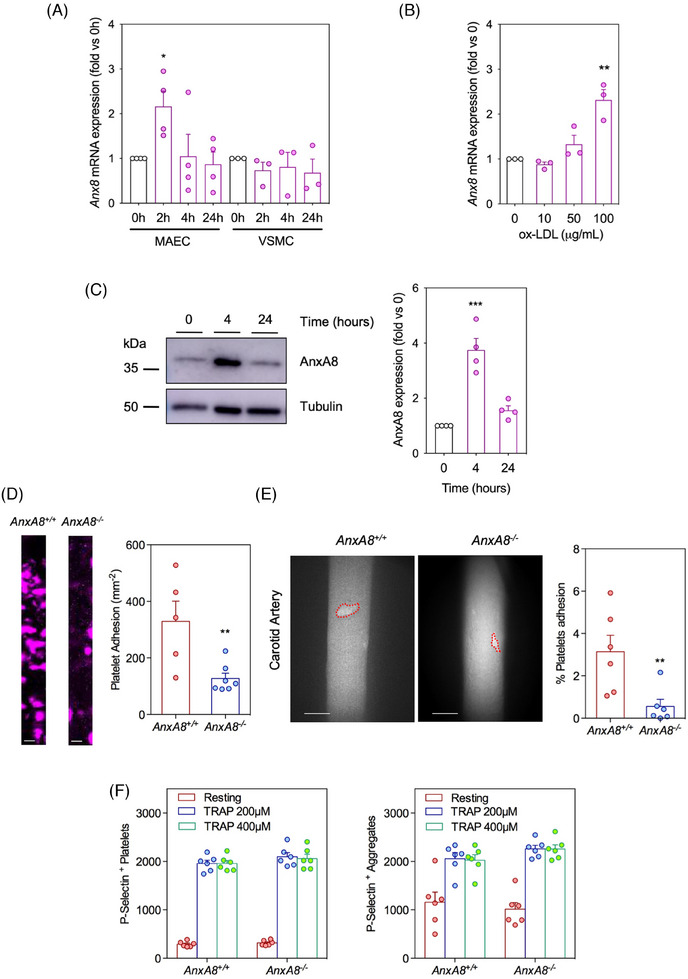
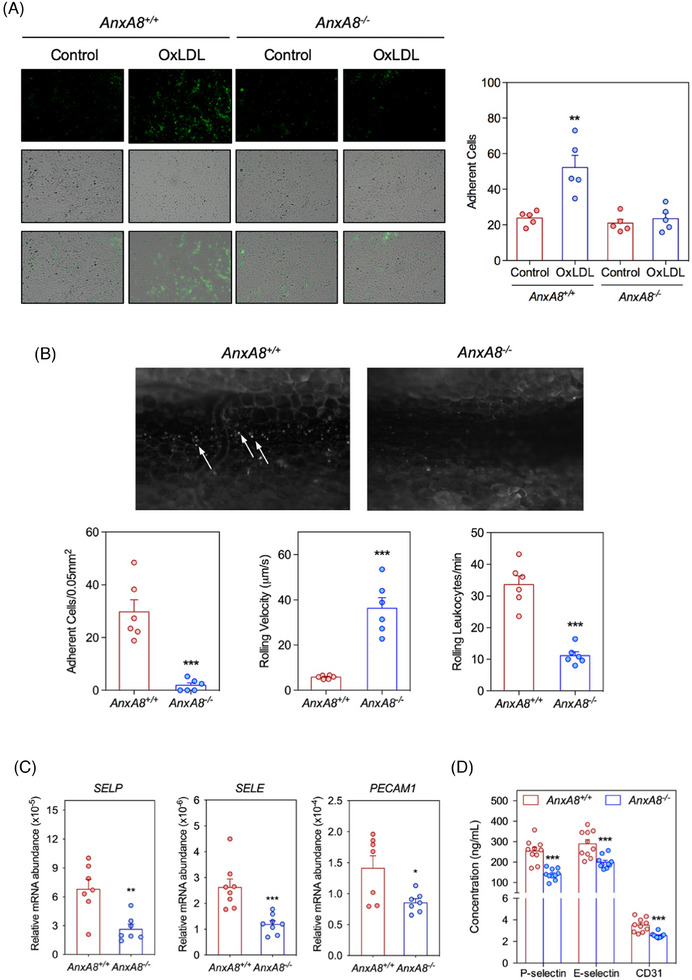
Results: RNA-Seq unveiled AnxA8 as one of the most significantly upregulated genes in atherosclerotic aortas of ApoE-/- compared to wild-type mice. Moreover, AnxA8 was upregulated in human atherosclerotic plaques. Germline deletion of AnxA8 decreased the atherosclerotic burden, the size and volume of atherosclerotic plaques in the aortic root. Plaques of ApoE-/-AnxA8-/- were characterized by lower lipid and inflammatory content, smaller necrotic core, thicker fibrous cap and less apoptosis compared with those in ApoE-/-AnxA8+/+. BMT showed that hematopoietic AnxA8 deficiency had no effect on atherosclerotic progression. Oxidized low-density lipoprotein (ox-LDL) increased AnxA8 expression in murine aortic endothelial cells (MAECs). In vitro experiments revealed that AnxA8 deficiency in MAECs suppressed P/E-selectin and CD31 expression and secretion induced by ox-LDL with a concomitant reduction in platelet and leukocyte adhesion. Intravital microscopy confirmed the reduction in leukocyte and platelet adhesion in ApoE-/-AnxA8-/- mice. Finally, endothelial-specific silencing of AnxA8 decreased atherosclerosis progression.

Conclusion: Our findings demonstrate that AnxA8 promotes the progression of atherosclerosis by modulating endothelial-leukocyte interactions. Interventions capable of reducing AnxA8 expression in endothelial cells may delay atherosclerotic plaque progression.

Key points: This study shows that AnxA8 is upregulated in aorta of atheroprone mice and in human atherosclerotic plaques. Germline AnxA8 deficiency reduces platelet and leukocyte recruitment to activated endothelium as well as atherosclerotic burden, plaque size, and macrophage accumulation in mice. AnxA8 regulates oxLDL-induced adhesion molecules expression in aortic endothelial cells. Our data strongly suggest that AnxA8 promotes disease progression through regulation of adhesion and influx of immune cells to the intima. Endothelial specific silencing of AnxA8 reduced atherosclerosis progression. Therapeutic interventions to reduce AnxA8 expression may delay atherosclerosis progression.

Keywords: AnxA8; atherosclerosis; inflammation.


Conflict of interest statement

The authors declare that the research was conducted in the absence of any commercial or financial relationships that could be construed as a potential conflict of interest.

Figures

FIGURE 1
FIGURE 1
AnxA8 expression is upregulated in human and mice atherosclerotic plaques. (A) through (C), RNA‐Seq analysis of aortas from four ApoE−/− mice with four WT mice (40‐week‐old male mice). (B) Volcano plot showing the 15 643 expressed genes. Significantly differentially expressed genes are depicted in red (upregulated) or blue (downregulated) colour (‐adjusted p‐value < .01 and Log2 fold change > 1). The dashed lines indicate fold change and p‐value significance threshold. The names indicated belong to the 30 genes with the largest statistically significant difference. (C) Heat map representing of 30 genes with the largest statistically significant difference between wild‐type and ApoE−/− mice. N = 4 animals per group. (D) Validation by RT‐qPCR of selected genes identified by RNA‐Seq. Relative AnxA8, CCL2, IL‐6 and Cdkn1c mRNA expression levels normalized to GAPDH mRNA expression of WT (N = 6) or ApoE−/− (N = 6) aortas. Data represent mean ± SEM. Student's t‐test. * p < .05 versus WT and ** p < .01 versus WT. (E) Immunostaining of AnxA8 (green) and its colocalization with ECs marker CD31 (red), and VSMCs marker α‐SMA (red) in aortic root sections of WT or ApoE−/− mice. Scale bar, 50 µm. (F) mRNA expression of AnxA8 in human carotid atherosclerotic plaques (N = 9) or healthy aortas (N = 10) and immunofluorescence staining of CD31, AnxA8 and α‐SMA in human atherosclerotic plaques. Data represent mean ± SEM. Student's t‐test. *** p < .001 versus healthy. Scale bar, 50 µm.
FIGURE 2
FIGURE 2
Germline AnxA8 deficiency attenuates atherosclerosis progression. (A) Work flow for generation of early and advanced atherosclerotic lesions in ApoE−/−AnxA8+/+ or ApoE−/−AnxA8−/ mice fed with a high‐fat diet. (B) Representative pinned‐out en face aorta preparations and quantification of atherosclerosis from 16 (early lesions) or (C) 36 (advanced lesions) weeks‐old mice stained with ORO. Data represent mean ± SEM of five animals per group. Student's t‐test. * p < .05 versus ApoE−/−AnxA8+/+ and *** p < .001 versus ApoE−/−AnxA8+/+ . (D) Representative ORO/haematoxylin staining and quantification of maximal lesion area in the aortic root of 16 (early lesions) weeks‐old mice. Data represent mean ± SEM of 8–11 animals per group. Student's t‐test. *** p < .001 versus ApoE−/−AnxA8+/+ . Scale bars, 200 µm. (E) Quantification of atherosclerotic lesion area along aortic root in 16 (early lesions) weeks‐old mice. (F) The volume of atherosclerotic lesions was estimated by calculating the area under the curve for each condition. Data represent mean ± SEM of eight animals per group. Student's t‐test. * p < .05; *** p < .001 versus ApoE−/−AnxA8+/+ . (G) Quantification of ORO in the aortic root from 16 weeks‐old ApoE−/−AnxA8+/+ or ApoE−/−AnxA8−/− mice. Data represent mean ± SEM of eight animals per group. Student's t‐test. ** p < .01 versus ApoE−/−AnxA8+/+ . (H) Representative ORO/haematoxylin staining and quantification of maximal lesion area in the aortic root of 36 (advanced lesions) weeks‐old mice. Data represent mean ± SEM of 10–11 animals per group. Student's t‐test. *** p < .001 versus ApoE−/−AnxA8+/+ . Scale bars, 200 µm. (I) Quantification of atherosclerotic lesion area along aortic root in 36 (advanced lesions) weeks‐old mice. (J) The volume of atherosclerotic lesions was estimated by calculating the area under the curve for each condition. Data represent mean ± SEM of 10–11 animals per group. Student's t‐test. * p < .05; ** p < .01*** p < .001 versus ApoE−/−AnxA8+/+ . (K) Quantification of ORO in the aortic root from 36 weeks‐old ApoE−/−AnxA8+/+ or ApoE−/−AnxA8−/− mice. Data represent mean ± SEM of 10–11 animals per group. Student's t‐test. *** p < .001 versus ApoE−/−AnxA8+/+ .
FIGURE 3
FIGURE 3
Germline AnxA8 deficiency decreases LDL retention in atherosclerotic lesions. (A) Representative images and quantitative analysis of Atto565‐LDL retention in the aortic root of ApoE−/−AnxA8+/+ or ApoE−/−AnxA8−/− mice after 20 h intravenous injection of LDL. Data represent mean ± SEM of 9–11 animals per group. Student's t‐test. ** p < .01. (B) Representative Sirius Red staining in the aortic root from 16 weeks‐old ApoE−/−AnxA8+/+ or ApoE−/−AnxA8−/− mice. Quantification of the positive area is shown in the right panel. Scale bars, 200 µm. Data represent mean ± SEM of eight animals per group. (C) Representative Sirius Red staining in the aortic root from 36 weeks‐old ApoE−/−AnxA8+/+ or ApoE−/−AnxA8−/− mice. Quantification of the positive area is shown in the right panel. Scale bars, 200 µm. Data represent mean ± SEM of 10–11 animals per group.
FIGURE 4
FIGURE 4
Germline AnxA8 deficiency increases atherosclerotic plaque stability. (A) Representative histological analysis of cross‐sections of the aortic sinus from 16 (early lesions) or (B) 36 (advanced lesions) weeks‐old ApoE−/−AnxA8+/+ and ApoE−/−AnxA8−/ mice stained with CD68, α‐SMA and DAPI. Quantification of macrophages or VSMCs content are shown in the panels below. Scale bars, 50 µm. Data represent mean ± SEM of 8–11 animals per group. Student's t‐test. ** p < .01 and *** p < .001 versus ApoE−/−AnxA8+/+ . (C) Representative histological analysis of cross‐sections of the aortic sinus stained with Masson's trichrome from 36 weeks‐old ApoE−/−AnxA8+/+  or ApoE−/−AnxA8−/ mice. Means of the necrotic core area and fibrous cap (FC) thickness calculated from Masson's trichrome–stained aortic cross‐sections were quantified and are shown (N 10 mice per group). Dashed lines indicate the boundary of the developing necrotic core (plaque acellular area). Scale bars, 100 µm. Student's t‐test. *** p < .001 versus ApoE−/−AnxA8+/+ . (D) Representative histological analysis of cross‐sections of the aortic sinus stained with TUNEL. Quantification of TUNEL‐positive nuclei is shown in the graph on the right. DAPI was used to stain the nuclei. Scale bars, 50 µm. Data represent mean ± SEM of 10–11 animals per group. Student's t‐test. *** p < .001 versus ApoE−/−AnxA8+/+ . (E) Histological classification of aortic root plaques complexity in the advanced model according to Stary's grading: II, early lesions (foam cells, SMCs, intracellular lipid accumulation); III, moderate lesions (foam cells, SMCs, pools of extracellular lipids); IV, atheroma (foam cells, SMCs, large pools of extracellular lipids, necrotic core); V, fibroatheroma (foam cells, SMCs, large pools of extracellular lipids, large irregular necrotic core).
FIGURE 5
FIGURE 5
Hematopoietic AnxA8 deficiency does not prevent atherosclerosis progression. (A) Work flow for generation of ApoE−/− chimeras with AnxA8+/+ or AnxA8−/− BM. (B) Weight and (C) serum cholesterol concentrations of ApoE−/− chimeras with AnxA8+/+ or AnxA8−/− BM after 12 weeks on HFD (mean ± SEM; n = 10 per group). (D) Representative pinned‐out en face aorta preparations and quantification of atherosclerosis from ApoE−/− chimeras with AnxA8+/+ or AnxA8−/− BM stained with ORO after 12 weeks on HFD. Data represent mean ± SEM of five animals per group. (E) Representative ORO/haematoxylin staining and quantification of maximal lesion area in the aortic root of ApoE−/− chimeras with AnxA8+/+ or AnxA8−/− BM after 12 weeks on HFD. Data represent mean ± SEM of 10 animals per group. Scale bars, 200 µm. (F) Quantification of atherosclerotic lesion area along aortic root in ApoE−/− chimeras with AnxA8+/+ or AnxA8−/− BM after 12 weeks on HFD. The volume of atherosclerotic lesions was estimated by calculating the area under the curve for each condition. Data represent mean ± SEM of 10 animals per group. (G) Quantification of ORO in the aortic root from ApoE−/− chimeras with AnxA8+/+ or AnxA8−/− BM after 12 weeks on HFD. Data represent mean ± SEM of 10 animals per group. (H) Representative Sirius Red staining in the aortic root from ApoE−/− chimeras with AnxA8+/+ or AnxA8−/− BM after 12 weeks on HFD. Quantification of the positive area is shown in the right panel. Data represent mean ± SEM of 10 animals per group. Scale bars, 200 µm.
FIGURE 6
FIGURE 6
Expression of AnxA8 is increased by ox‐LDL in MAECs and platelet adhesion to endothelial cells in vitro and in vivo. (A) Relative AnxA8 expression levels normalized to 18s rRNA of MAECs or VSMCs treated with or without ox‐LDL (100 µg/mL) for 0–24 h. Values shown are mean ± SEM of 3–4 different experiments. ANOVA Tukey's post hoc. * p < .05 versus 0 h. (B) Relative AnxA8 expression levels normalized to 18s rRNA of MAECs treated with or without ox‐LDL (10–100 µg/mL) for 2 h. Values shown are mean ± SEM of three different experiments. ANOVA Tukey's post hoc. * p < .05 versus 0 h. (C) Representative western blot analysis of AnxA8 in MAECs treated with ox‐LDL (100 µg/mL) during 0−24 h. Tubulin was used as loading control. Values shown are mean ± SEM of four different experiments. ANOVA Tukey's post hoc. *** p < .001 versus 0 h. (D) Representative fluorescence images depicting platelets adhering to endothelial ApoE−/−AnxA8+/+ or ApoE−/−AnxA8−/ surface for 5 min at a venous shear stress of 2 dynes/cm2 in a microfluidic flow condition. Data represent mean ± SEM of 5–7 different experiment per group. Student's t‐test. ** p < .01 versus AnxA8+/+ . Scale bars, 200 µm. (E) Fluorescent intravital microscopy images illustrating the Alexa 647‐labelled platelets in incipient lesional carotids of ApoE−/−AnxA8+/+ or ApoE−/−AnxA8−/− mice after 4 weeks of HFD. Quantification of percentage of platelets coverage area in the carotid zone analysed is represented in the right panel. Data represent mean ± SEM of six animals per group. Student's t‐test. ** p < .01 versus ApoE−/−AnxA8+/+ . Scale bars, 200 µm. (F) Flow cytometry analysis of P‐selectin expression and platelets aggregation in ApoE−/−AnxA8+/+ or ApoE−/−AnxA8−/− platelets. Bar graph representing the fluorescence intensity for P‐selectin of platelets and aggregates of non‐treated (resting) and TRAP‐stimulated ApoE−/−AnxA8+/+ or ApoE−/−AnxA8−/− platelets.
FIGURE 7
FIGURE 7
AnxA8 deletion diminishes adhesion molecules expression and secretion in aortic endothelial cells. (A) Relative Selp, Sele and Pecam‐1 expression levels normalized to 18s rRNA of endothelial cells treated with or without ox‐LDL (100 µg/mL) for 0−4 h. The same cDNA was repeatedly tested for multiple genes. Values shown are mean ± SEM of three different experiments. ANOVA Tukey's post hoc. # p < .05 or ## p < .01 versus 0 h ApoE−/−AnxA8+/+ ; * p < .05, ** p < .01 or *** p < .001 versus ApoE−/−AnxA8+/+ . (B) Representative western blot analysis of P/E‐selectin and CD31 in MAECs treated with ox‐LDL (100 µg/mL) during 0−4 h. Tubulin was used as loading control. Values shown are mean ± SEM of three different experiments. ANOVA Tukey's post hoc. *** p < .001 versus 0 h. (C) Representative immunofluoresce and mean fluorescence intensity of P‐selectin, E‐selectin or CD31 in endothelial cells treated with or without ox‐LDL (100 µg/mL) during 4 h. Scale bars, 50 µm. (D) Secretion of P‐selectin, E‐selectin or CD31 in endothelial cells treated with or without ox‐LDL (100 µg/mL) during 0−24 h. Values shown are mean ± SEM of three different experiments. ANOVA Tukey's post hoc. ### p < .001 versus 0 h ApoE−/−AnxA8+/+ ; * p < .05, ** p < .01 or *** p < .001 versus ApoE−/−AnxA8+/+ . (E) Representative western blot analysis of p‐Akt and Akt in MAECs treated with ox‐LDL (100 µg/mL). Right panel shows the quantification of band densitometry values of p‐Akt protein levels expressed in arbitrary units after correction for Akt (loading control). * p < .05 or ** p < .01 versus 0 h. ANOVA Tukey's post hoc.
FIGURE 8
FIGURE 8
AnxA8 deficiency diminishes leukocytes adhesion to endothelial cells. (A) Representative fluorescence and light‐field images of calcein‐labelled PBMCs on ApoE−/−AnxA8+/+ or ApoE−/−AnxA8−/− endothelial monolayer in the absence or presence of ox‐LDL. Quantification of the number of calcein‐labelled PBMCs in 10 random fields analysed in each condition. Values shown are mean ± SEM of five different experiments. Student's t‐test. ** p < .01 versus control. Scale bars, 100 µm. (B) Fluorescent intravital microscopy images of rhodamine 6G‐labelled leukocytes on calcium ionophore‐activated mesenteric venules of ApoE−/−AnxA8+/+ or ApoE−/−AnxA8−/− mice after 4 weeks of HFD. Arrows indicated adhering leukocytes. Number of firmly adherent leukocytes, rolling velocity and rolling leukocytes are represented below. Data represent mean ± SEM of six animals per group. Student's t‐test. *** p < .001 versus ApoE−/−AnxA8+/+ . Scale bars, 100 µm. (C) Relative Selp, Sele and Pecam‐1 expression levels normalized to 18s rRNA of aorta from ApoE−/−AnxA8+/+ or ApoE−/−AnxA8−/− mice. The same cDNA was repeatedly tested for multiple genes. Values shown are mean ± SEM of seven animals per group. Student's t‐test. * p < .05, ** p < .01 or *** p < .001 versus ApoE−/−AnxA8+/+ . (D) P‐selectin, E‐selectin or CD31 concentrations in serum of ApoE−/−AnxA8+/+ or ApoE−/−AnxA8−/ mice after fed HFD for 12 weeks (advanced lesions). Data represent mean ± SEM of 10 animals per group. Student's t‐test. ** p < .01 or *** p < .001 versus ApoE−/−AnxA8+/+ .
FIGURE 9
FIGURE 9
AnxA8 inhibition in endothelial cells reduces atherosclerosis progression. (A) Work flow for generation of endothelial AnxA8‐deficient animals in ApoE−/−AnxA8+/+ mice fed with a high‐fat diet. (B) Representative immunofluorescence showing GFP expression in ApoE−/−AnxA8+/+ mice injected with pAAV2‐QuadYF‐shScr or pAAV2‐QuadYF‐shAnxA8. Scale bars, 25 µm. (C) Representative immunofluorescence of AnxA8 (green) and their colocalization with ECs marker CD31 (red) or VSMCs marker α‐SMA (red) in aortic root sections of ApoE−/−AnxA8+/+ mice injected with pAAV2‐QuadYF‐shScr or pAAV2‐QuadYF‐shAnxA8. Scale bars, 25 µm. (D) Representative pinned‐out en face aorta preparations and quantification of atherosclerosis from ApoE−/−AnxA8+/+ mice injected with pAAV2‐QuadYF‐shScr or pAAV2‐QuadYF‐shAnxA8 stained with ORO after 10 weeks on HFD. Data represent mean ± SEM of five animals per group. * p < .05; *** p < .001 versus pAAV2‐QuadYF‐shScr. (E) Representative ORO/haematoxylin staining and quantification of maximal lesion area in the aortic root of ApoE−/−AnxA8+/+ mice injected with pAAV2‐QuadYF‐shScr or pAAV2‐QuadYF‐shAnxA8 stained with ORO after 10 weeks on HFD. Data represent mean ± SEM of eight animals per group. Student's t‐test. ** p < .01; *** p < .001 versus pAAV2‐QuadYF‐shScr. Scale bars, 200 µm. (F) Quantification of atherosclerotic lesion area along aortic root in ApoE−/−AnxA8+/+ mice injected with pAAV2‐QuadYF‐shScr or pAAV2‐QuadYF‐shAnxA8. The volume of atherosclerotic lesions was estimated by calculating the area under the curve for each condition. Data represent mean ± SEM of eight animals per group. Student's t‐test. ** p < .01; *** p < .001 versus pAAV2‐QuadYF‐shScr. (G) Quantification of ORO in the aortic root from ApoE−/−AnxA8+/+ mice injected with pAAV2‐QuadYF‐shScr or pAAV2‐QuadYF‐shAnxA8 after 10 weeks on HFD. Data represent mean ± SEM of eight animals per group. ** p < .01 versus pAAV2‐QuadYF‐shScr. (H) Representative histological analysis of cross‐sections of the aortic sinus from ApoE−/−AnxA8+/+ mice injected with pAAV2‐QuadYF‐shScr or pAAV2‐QuadYF‐shAnxA8 stained with CD68, α‐SMA and DAPI. Quantification of macrophages or VSMCs content are shown in the right panels. Scale bars, 100 µm. Data represent mean ± SEM of 10–11 animals per group. Student's t‐test. *** p < .001 versus pAAV2‐QuadYF‐shScr.

References

    1. WHO CVD Risk Chart Working Group . World Health Organization Cardiovascular Disease Risk Charts: revised models to estimate risk in 21 global regions. Lancet Glob Health. 2019;7(10):e1332‐e1345. doi:10.1016/S2214-109X(19)30318-3 - DOI - PMC - PubMed
    1. Lu H, Daugherty A. Atherosclerosis. Arterioscler Thromb Vasc Biol. 2015;35(3):485‐491. doi:10.1161/ATVBAHA.115.305380 - DOI - PMC - PubMed
    1. Libby P, Buring JE, Badimon L, et al. Atherosclerosis. Nat Rev Dis Primer. 2019;5(1):56. doi:10.1038/s41572-019-0106-z - DOI - PubMed
    1. Gencer S, Evans BR, van der Vorst EPC, Döring Y, Weber C. Inflammatory chemokines in atherosclerosis. Cells. 2021;10(2):226. doi:10.3390/cells10020226 - DOI - PMC - PubMed
    1. Sreeramkumar V, Adrover JM, Ballesteros I, et al. Neutrophils scan for activated platelets to initiate inflammation. Science. 2014;346(6214):1234‐1238. doi:10.1126/science.1256478 - DOI - PMC - PubMed