. 2025 Jan 21:13:RP94420.
doi: 10.7554/eLife.94420.

Paradoxical dominant negative activity of an immunodeficiency-associated activating PIK3R1 variant

Affiliations

Paradoxical dominant negative activity of an immunodeficiency-associated activating PIK3R1 variant

Patsy R Tomlinson et al. Elife. .

Abstract

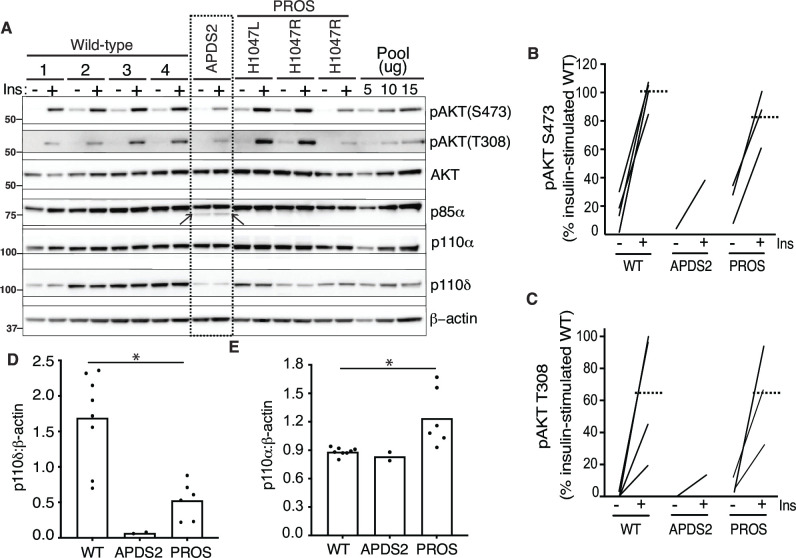
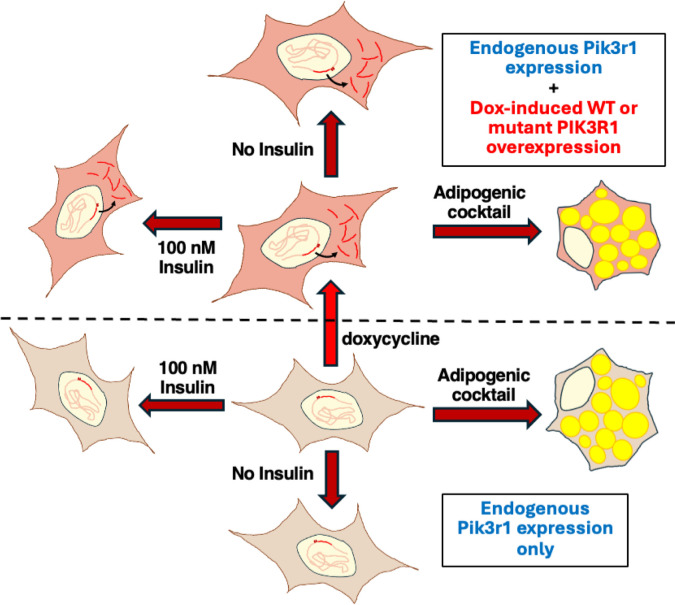
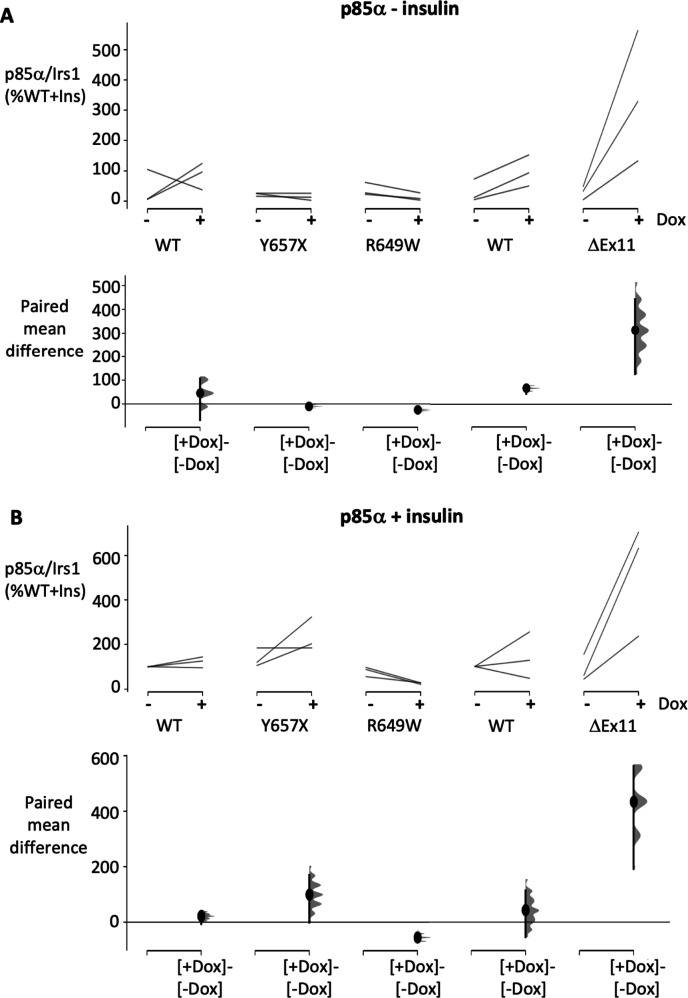
PIK3R1 encodes three regulatory subunits of class IA phosphoinositide 3-kinase (PI3K), each associating with any of three catalytic subunits, namely p110α, p110β, or p110δ. Constitutional PIK3R1 mutations cause diseases with a genotype-phenotype relationship not yet fully explained: heterozygous loss-of-function mutations cause SHORT syndrome, featuring insulin resistance and short stature attributed to reduced p110α function, while heterozygous activating mutations cause immunodeficiency, attributed to p110δ activation and known as APDS2. Surprisingly, APDS2 patients do not show features of p110α hyperactivation, but do commonly have SHORT syndrome-like features, suggesting p110α hypofunction. We sought to investigate this. In dermal fibroblasts from an APDS2 patient, we found no increased PI3K signalling, with p110δ expression markedly reduced. In preadipocytes, the APDS2 variant was potently dominant negative, associating with Irs1 and Irs2 but failing to heterodimerise with p110α. This attenuation of p110α signalling by a p110δ-activating PIK3R1 variant potentially explains co-incidence of gain-of-function and loss-of-function PIK3R1 phenotypes.

Keywords: APDS2; PIK3R1; SHORT syndrome; genetics; genomics; human; immunodeficiency; immunology; inflammation; insulin resistance; mouse; phosphoinositide 3-kinase.


Conflict of interest statement

PT, RK, OP, HS, GB, RW No competing interests declared, RS Consulting for Novartis on clinical aspects of PIK3CA-related overgrowth, and for Alnylam, Amryt and AstraZeneca on clinical aspects of monogenic insulin resistance and lipodystrophy

Figures

Figure 1.
Figure 1.. Phosphoinositide 3-kinase (PI3K) subunit expression and signalling in primary dermal fibroblasts.
Immunoblotting of AKT, AKT phosphorylated at threonine 308 (T308) or serine 473 (S473), p85α, p110δ, and p110α and are shown with and without stimulation by 100 nM insulin (Ins) for 10 min. β-Actin is shown as a loading control, with different amounts of pooled lysate (Pool) used to demonstrate signal intensity in the linear range. Molecular weight markers (in kDa) are indicated to the left. Results are shown from four healthy controls (wild-type [WT]; 1–4), one patient with activating p110 delta syndrome 2 (APDS2) due to the p85α Δexon11 variant, and three patients with PIK3CA-related overgrowth spectrum (PROS) caused by the activating PIK3CA mutations indicated. (A) Immunoblots, with the truncated p85α Δexon11 variant arrowed. (B–E) Quantification of immunoblot bands from three independent experiments are shown for phosphoAKT-S473, phosphoAKT-T308, p110δ, and p110α, respectively. Each point represents data from one of the patient cell lines in the immunoblots. Paired datapoints ± insulin are shown in (B) and (C), and dotted lines mark means. Asterisks indicate a significant difference. More detailed statistical analysis including 95% confidence intervals for the paired mean differences for these comparisons are shown in Figure 1—figure supplement 2.
Figure 1—figure supplement 1.
Figure 1—figure supplement 1.. Schematic illustrating the PIK3R1 variants studied.
All three protein products of PIK3R1 are illustrated, namely p85α, p55α, and p50α. The site of the heterozygous in-frame deletion caused by skipping of exon 11 that explains most cases of activating p110 delta syndrome 2 (APDS2) is indicated as well as the three heterozygous SHORT syndrome causal variants studied, including the commonest causal variant R649W. All proteins and variants studied are indicated in red. For reference the reported truncating homozygous variants that disrupt only p85α and that are associated with agammaglobulinaemia are also shown. BH = BCR homology, nSH2=N-terminal SH2, cSH2=C-terminal SH2, iSH2=inter-SH2 domain.
Figure 1—figure supplement 2.
Figure 1—figure supplement 2.. Further characterisation of primary dermal fibroblasts studied.
(A) Details of cDNA sequence for PIK3CA and PIK3R1 from cells derived from healthy controls (wild-type [WT]), patients with activating p110 delta syndrome 2 (APDS2) (p85α ΔEx11) or PIK3CA-related overgrowth spectrum (PROS), confirming expected expression of mutant alleles. (B) Higher magnification detail of immunoblot from WT and APDS2 fibroblasts (arrowed lane) showing truncated p85α Δex11 in APDS2 cells only. (C) Close-up view of all three immunoblot replicates for p110δ blots quantified in Figure 1 (APDS2 and adjacent genotypes only), showing severely reduced p110δ expression in the APDS2 cell line.
Figure 1—figure supplement 3.
Figure 1—figure supplement 3.. Full statistical analysis of data presented in main Figure 1 analysis of insulin-induced increase in (A) AKT S473/4 and (B) T308/9 phosphorylation.
The paired mean difference for are shown in Cumming estimation plots. The raw data, as presented in Figure 1, are re-plotted on the upper axes with paired observations connected by a line. On the lower axes, paired mean differences are plotted as a bootstrap sampling distribution. Mean differences are depicted as dots; 95% confidence intervals are indicated by the ends of the vertical error bars. (C, D) Analysis of differences in (C) p110α and (D) p110δ protein expression between healthy control cells and cells from PIK3CA-related overgrowth spectrum (PROS) patients harbouring activating PIK3CA mutations. Mean differences are shown in Gardner-Altman estimation plots, with expression data plotted on the left axes and mean difference on floating axes on the right, again as a bootstrap sampling distribution with mean difference depicted as a dot and 95% confidence intervals by the ends of the vertical bar.
Figure 2.
Figure 2.. Blunted insulin signalling in 3T3-L1 preadipocyte models of activating p110 delta syndrome 2 (APDS2) and SHORT syndrome.
Immunoblotting of Akt, Akt phosphorylated at threonine 308 (T308) or serine 473 (S473), p85α, and p110α and are shown with and without stimulation with 100 nM insulin (Ins) for 10 min. Molecular weight markers (in kDa) are indicated to the left. Cells were treated with doxycycline (Dox) 1 μg/mL for 72 hr prior to insulin stimulation as indicated. (A) One immunoblot representing three experiments is shown. (B, C) Quantification of immunoblot bands from all three independent experiments shown for phosphoAkt-S473 and phosphoAkt-T308, respectively. Paired datapoints ± insulin are shown, and dotted lines mark means. Asterisks indicate a significant difference. More detailed statistical analysis including 95% confidence intervals for the paired mean differences for these comparisons are shown in Figure 2—figure supplement 2. (D) Staining for neutral lipid with Oil Red O of 3T3-L1 cells at day 10 of adipocyte differentiation. Induction of transgene expression by 1 μg/mL Dox throughout differentiation is shown. Images of entire plates are shown above, with representative bright-field microscopy images below. Scale bars on micrographs are 100 μm.
Figure 2—figure supplement 1.
Figure 2—figure supplement 1.. Schematic illustrating experimental design for 3T3-L1 studies.
Wild-type 3T3-L1 murine preadipocytes with intact endogenous Pik3r1 expression were infected with pSLIK lentivirus with a payload of wild-type or mutant human PIK3R1 under control of a doxycycline-responsive promoter. After selection stable cells with or without doxycycline exposure to induce transgenic PIK3R1 expression were either differentiated to adipocytes, or stimulated with 100 nM insulin as indicated.
Figure 2—figure supplement 2.
Figure 2—figure supplement 2.. Full statistical analysis of data presented in main Figure 2.
Analysis of the effects of doxycycline-induced expression of wild-type (WT) or ΔEx11 (activating p110 delta syndrome 2 [APDS2]) p85α, or of p110α H1047R (PIK3CA-related overgrowth spectrum [PROS]) on Akt S473/4 (A, B) and T308/9 (C, D) phosphorylation. Comparisons are made in both the basal, non-insulin-stimulated state (A, C) and after stimulation with 10 nmol/L insulin (B, D). Paired mean differences for three comparisons are shown in Cumming estimation plots. Raw data, as presented in Figure 2, are re-plotted on the upper axes with paired observations connected by a line. On the lower axes, paired mean differences are plotted as a bootstrap sampling distribution. Mean differences are depicted as dots; 95% confidence intervals are indicated by the ends of the vertical error bars.
Figure 2—figure supplement 3.
Figure 2—figure supplement 3.. The effect of graded expression of wild-type or disease-associated p85α on 3T3-L1 preadipocytes.
Immunoblots of p85α, phosphoAkt (S473), and total Akt are shown for control 3T3-L1 cells and 3T3-L1 cells conditionally expressing wild-type (WT), or activating p110 delta syndrome 2 (APDS2)-associated mutant p85α under the control of doxycycline (Dox), with and without 10 min of exposure to insulin as indicated. The filled black triangles indicate increasing concentrations of Dox (from left to right: 0, 0.02, 0.03, 0.045, 0.065, or 0.1 μg/mL). Exposure was for 72 hr in all cases. The truncated p85α variant can be seen below the WT p85α for the APDS2 ΔEx11 mutant.
Figure 3.
Figure 3.. SHORT syndrome p85α mutations impair phosphotyrosine-stimulated phosphoinositide 3-kinase (PI3K) activity.
Lipid kinase activity of purified recombinant PI3K complexes generated using baculoviral expression in Sf9 cells was measured using a modified fluorescence polarisation assay. Wild-type (WT) p85α or p85α SHORT syndrome mutations, E489K, R649W, or Y657X bound to either (A) p110α, (B) p110β, or (C) p110δ were assayed for basal and bisphosphotyrosine (pY2)-stimulated lipid kinase activity. Dotted lines mark means, and asterisks indicate a significant difference between the bisphosphotyrosine (pY2)-stimulated state for WT and comparator mutant p85α. More detailed statistical analysis including 95% confidence intervals for the paired mean differences for these comparisons are shown in Figure 3—figure supplement 1.
Figure 3—figure supplement 1.
Figure 3—figure supplement 1.. Full statistical analysis of data presented in main Figure 3.
Analysis of fluorescence polarisation assay of phosphoinositide 3-kinase (PI3K) activity of in vitro synthesised wild-type (WT) or mutant (E489K, R649W, or Y657X) p85α. Results for p110α- and p110β-containing PI3K are shown in (A) and (B) respectively. All data were acquired in the presence of phosphotyrosine peptide. Paired mean differences for three comparisons are shown in Cumming estimation plots. Raw data, as presented in Figure 3, are re-plotted on the upper axes with paired observations connected by a line. On the lower axes, paired mean differences are plotted as a bootstrap sampling distribution. Mean differences are depicted as dots; 95% confidence intervals are indicated by the ends of the vertical error bars. Results for the R649W p85α mutation are only shown with p110δ in (C). In this case raw data are re-plotted on the left-hand axes with paired observations connected by three nearly superimposed lines. On the right-hand axes, paired mean differences are plotted as a bootstrap sampling distribution.
Figure 4.
Figure 4.. Ability of pathogenic p85α variants to bind p110α, assessed by co-immunoprecipitation.
Results of immunoblotting of anti-p110α immunoprecipitates from 3T3-L1 cells expressing wild-type (WT), activating p110 delta syndrome 2 (APDS2)-associated or SHORT syndrome-associated mutant p85α under the control of doxycycline (Dox) are shown. (A) One representative immunoblot of immunoprecipitate, cell lysate prior to immunoprecipitation, and post immunoprecipitation supernatant is shown. Molecular weight markers (in kDa) are indicated to the left. between gel images. (B) Quantification of immunoblot bands from immunoprecipitates from three independent experiments, expressed as a percentage relative to the intensity of the band in WT cells without Dox exposure. Co-immunoprecipitated p85α is shown normalised to immunoprecipitated p110α from all three independent experiments. Datapoints from the same experiment ± Dox are connected by lines. No significant differences were found among conditions.
Figure 5.
Figure 5.. Attenuated insulin-induced association of p110α with Irs1 in the presence of activating p110 delta syndrome 2 (APDS2) and SHORT syndrome mutant p85α.
Results of immunoblotting of anti-Irs1 immunoprecipitates from 3T3-L1 cells expressing wild-type, APDS2-associated, or SHORT syndrome-associated mutant p85α under the control of doxycycline (Dox) are shown. Treatment with 100 nM insulin (Ins) is indicated. (A) One representative immunoblot of immunoprecipitate, cell lysate prior to immunoprecipitation, and post immunoprecipitation supernatant is shown. Two separate sets of gels, including independent wild-type controls, are shown on left and right. Molecular weight markers (in kDa) are indicated between gel images. (B, C) Quantification of immunoblot bands from immunoprecipitates from three independent experiments. Immunoprecipitated p110α is shown normalised to immunoprecipitated Irs1 from all three independent experiments in (B), and immunoprecipitated p85α similarly in (C). Datapoints from the same experiment -± insulin are connected by lines. Asterisks indicate significant differences induced by transgene overexpression (i.e. plus versus minus doxycycline). More detailed statistical analysis including 95% confidence intervals for the paired mean differences for these comparisons are shown in Figure 5—figure supplements 1 and 2.
Figure 5—figure supplement 1.
Figure 5—figure supplement 1.. Full statistical analysis of data presented in main Figure 5A and B.
Analysis of the effects of doxycycline (Dox)-induced expression of wild-type (WT), Y657X, R649W, or ΔEx11 p85α on association of p110α with Irs1. Comparisons are made in both the basal, non-insulin-stimulated state (A) and after stimulation with 10 nmol/L insulin (B) are shown. Paired mean differences for three comparisons are shown in Cumming estimation plots. Raw data, as presented in Figure 5B, are re-plotted on the upper axes with paired observations connected by a line. On the lower axes, paired mean differences are plotted as a bootstrap sampling distribution. Mean differences are depicted as dots; 95% confidence intervals are indicated by the ends of the vertical error bars.
Figure 5—figure supplement 2.
Figure 5—figure supplement 2.. Full statistical analysis of data presented in main Figure 5A and C.
Analysis of the effects of doxycycline (Dox)-induced expression of wild-type (WT), Y657X, R649W, or ΔEx11 p85α on association of p85α with Irs1. Comparisons are made in both the basal, non-insulin-stimulated state (A) and after stimulation with 10 nmol/L insulin (B) are shown. Paired mean differences for three comparisons are shown in Cumming estimation plots. Raw data, as presented in Figure 5C, are re-plotted on the upper axes with paired observations connected by a line. On the lower axes, paired mean differences are plotted as a bootstrap sampling distribution. Mean differences are depicted as dots; 95% confidence intervals are indicated by the ends of the vertical error bars.
Figure 6.
Figure 6.. Attenuated insulin-induced association of p110α with Irs2 in the presence of activating p110 delta syndrome 2 (APDS2) and SHORT syndrome mutant p85α.
Results of immunoblotting of anti-Irs2 immunoprecipitates from 3T3-L1 cells expressing wild-type, APDS2-associated, or SHORT syndrome-associated mutant p85α under the control of doxycycline (Dox) are shown. Treatment with 100 nM insulin (Ins) is indicated. (A) One representative immunoblot of immunoprecipitate, cell lysate prior to immunoprecipitation, and post immunoprecipitation supernatant is shown. Two separate sets of gels, including independent wild-type controls are shown on left and right. Molecular weight markers (in kDa) are indicated between gel images. (B, C) Quantification of immunoblot bands from immunoprecipitates from three independent experiments. Immunoprecipitated p110α is shown normalised to immunoprecipitated Irs2 from all three independent experiments in (B), and immunoprecipitated p85α similarly in (C). Datapoints from the same experiment ± insulin are connected by lines. More detailed statistical analysis including 95% confidence intervals for the paired mean differences for these comparisons are shown in Figure 6—figure supplements 1 and 2.
Figure 6—figure supplement 1.
Figure 6—figure supplement 1.. Full statistical analysis of data presented in Figure 6A and B.
Analysis of the effects of doxycycline (Dox)-induced expression of wild-type (WT), Y657X, R649W, or ΔEx11 p85α on association of p110α with Irs2. Comparisons are made in both the basal, non-insulin-stimulated state (A) and after stimulation with 10 nmol/L insulin (B). Paired mean differences for three comparisons are shown in Cumming estimation plots. Raw data, as presented in Figure 6B, are re-plotted on the upper axes with paired observations connected by a line. On the lower axes, paired mean differences are plotted as a bootstrap sampling distribution. Mean differences are depicted as dots; 95% confidence intervals are indicated by the ends of the vertical error bars.
Figure 6—figure supplement 2.
Figure 6—figure supplement 2.. Full statistical analysis of data presented in Figure 6A and C.
Analysis of the effects of doxycycline (Dox)-induced expression of wild-type (WT), Y657X, R649W, or ΔEx11 p85α on association of p85α with Irs2. Comparisons are made in both the basal, non-insulin-stimulated state (A) and after stimulation with 10 nmol/L insulin (B). Paired mean differences for three comparisons are shown in Cumming estimation plots. Raw data, as presented in Figure 6C, are re-plotted on the upper axes with paired observations connected by a line. On the lower axes, paired mean differences are plotted as a bootstrap sampling distribution. Mean differences are depicted as dots; 95% confidence intervals are indicated by the ends of the vertical error bars.

Update of

References

    1. Angulo I, Vadas O, Garçon F, Banham-Hall E, Plagnol V, Leahy TR, Baxendale H, Coulter T, Curtis J, Wu C, Blake-Palmer K, Perisic O, Smyth D, Maes M, Fiddler C, Juss J, Cilliers D, Markelj G, Chandra A, Farmer G, Kielkowska A, Clark J, Kracker S, Debré M, Picard C, Pellier I, Jabado N, Morris JA, Barcenas-Morales G, Fischer A, Stephens L, Hawkins P, Barrett JC, Abinun M, Clatworthy M, Durandy A, Doffinger R, Chilvers ER, Cant AJ, Kumararatne D, Okkenhaug K, Williams RL, Condliffe A, Nejentsev S. Phosphoinositide 3-kinase δ gene mutation predisposes to respiratory infection and airway damage. Science. 2013;342:866–871. doi: 10.1126/science.1243292. - DOI - PMC - PubMed
    1. Avila M, Dyment DA, Sagen JV, St-Onge J, Moog U, Chung BHY, Mo S, Mansour S, Albanese A, Garcia S, Martin DO, Lopez AA, Claudi T, König R, White SM, Sawyer SL, Bernstein JA, Slattery L, Jobling RK, Yoon G, Curry CJ, Merrer ML, Luyer BL, Héron D, Mathieu-Dramard M, Bitoun P, Odent S, Amiel J, Kuentz P, Thevenon J, Laville M, Reznik Y, Fagour C, Nunes ML, Delesalle D, Manouvrier S, Lascols O, Huet F, Binquet C, Faivre L, Rivière JB, Vigouroux C, Njølstad PR, Innes AM, Thauvin-Robinet C. Clinical reappraisal of SHORT syndrome with PIK3R1 mutations: toward recommendation for molecular testing and management. Clinical Genetics. 2016;89:501–506. doi: 10.1111/cge.12688. - DOI - PubMed
    1. Brachmann SM, Ueki K, Engelman JA, Kahn RC, Cantley LC. Phosphoinositide 3-kinase catalytic subunit deletion and regulatory subunit deletion have opposite effects on insulin sensitivity in mice. Molecular and Cellular Biology. 2005;25:1596–1607. doi: 10.1128/MCB.25.5.1596-1607.2005. - DOI - PMC - PubMed
    1. Bravo García-Morato M, García-Miñaúr S, Molina Garicano J, Santos Simarro F, Del Pino Molina L, López-Granados E, Ferreira Cerdán A, Rodríguez Pena R. Mutations in PIK3R1 can lead to APDS2, SHORT syndrome or a combination of the two. Clinical Immunology. 2017;179:77–80. doi: 10.1016/j.clim.2017.03.004. - DOI - PubMed
    1. Burke JE, Vadas O, Berndt A, Finegan T, Perisic O, Williams RL. Dynamics of the phosphoinositide 3-kinase p110δ interaction with p85α and membranes reveals aspects of regulation distinct from p110α. Structure. 2011;19:1127–1137. doi: 10.1016/j.str.2011.06.003. - DOI - PMC - PubMed

MeSH terms

Substances

Supplementary concepts