. 2025 Apr 2;15(4):818-837.
doi: 10.1158/2159-8290.CD-23-0543.

Bone-Induced HER2 Promotes Secondary Metastasis in HR+/HER2- Breast Cancer

Affiliations

Bone-Induced HER2 Promotes Secondary Metastasis in HR+/HER2- Breast Cancer

Rahat Alam et al. Cancer Discov. .

Abstract

Given the urgent need for alternative strategies to block metastasis progression, we demonstrate that blocking HER2-mediated secondary metastasis improves clinical outcome and establish HER2 as a biomarker for bone metastasis in patients with initial HR+/HER2- breast cancer, which represents ∼70% of all cases.


Conflict of interest statement

The authors declare no potential conflicts of interest.

Figures
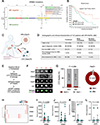
Figure 1:
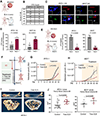
Figure 1:. Her2-expressing (Her2E) CTC analysis shows a non-invasive diagnostic potential for bone metastasis in luminal breast cancer.
A- Mutation diagram showing mutation types and position on the Her2 gene (ERBB2). The dots are presented with different colors, specific to each type of mutation as indicated on the figure annotation. Cancer hot spots and OncoKB curated mutations are shown in orange and blue, respectively. The y-axis represents the percentage of ERBB2 mutation detected in each cohort of patients; Bone metastasis-positive patients (bottom) and other metastases (top). B- Survival plot of breast cancer patients with ERBB2 mutations based on bone metastasis status (Bone met vs Other met). The number of patients (n) is shown on the graph. Significant P-value < 0.05 (Log-rank test). C- Diagram summarizing the experimental approach used for CTC analysis in patients with ER+/Her2− primary breast cancer. D- Demographic and clinical characteristics of 137 patients with HR-positive Her2-negative MBC. E- Experimental design of CTC collection and processing from MBC patients. F- Representative images of CTCs after CellSearch processing. CTCs are CK positive, DAPI positive, and CD45 negative. Her2 expression was evaluated using the FITC anti-Her2 antibody, and categorized as Her2 negative (0), weak (1+), moderate (2+), and strong (3+). CK (green) and DAPI (purple) are shown as merged images. G- Quantification of Her2E CTC fraction in breast cancer patients with bone metastasis (BM+) or visceral metastasis (BM-). This is based on 137 patients with a total of 13,372 CTCs. P-value: Chi-Square test. The Donut plot shows the proportion of Her2E CTCs according to bone metastasis status. H- Heatmap showing the mRNA expression of epithelial growth factor receptors in human CTCs from patients with luminal breast cancer (GSE86978). I-L: Dot plots comparing the expression of ERBB2, ERBB3, ERBB4, and EGFR in CTCs derived from patients with bone (BM+) or visceral metastasis (VM+). P-values: unpaired one-tailed t-test with Welch’s correction. Error bars: mean +/− SD.
Figure 2:
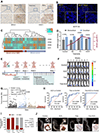
Figure 2:. Bone metastasis promotes Her2E CTCs in HR+/Her2− xenografts that can be blocked by anti-Her2 therapy.
A- Diagram describing the experimental strategy for bone metastasis and CTC collection. Cells were transplanted via intra-iliac artery injection. B- Table showing CTC counts in ZR75-1 and MCF7 models of bone metastasis. C- Representative fluorescent images of CTCs collected from HR+/Her2− breast cancer bone metastasis bearing mice. Her2 (red), Cytokeratin 8 (K8) green; DAPI (blue). Scale bars, 10 a.u. D- Quantification of bone metastasis-derived CTCs based on Her2 status. P-value: two-tailed paired t-test. Mean +/− SD. E- Quantification of CTCs following a short-term in vivo exposure via intracardiac injection (IC). P-value: two-tailed paired t-test. Mean +/− SD. F- Bone metastasis treatment strategy using a bone-targeting anti-Her2 antibody conjugate (Tras-ALN). G- Tumor growth in IIA-induced bone metastasis models (ZR75-1). Control (ALN-treated; n=14 mice) and anti-Her2 (Tras-ALN; n=14 mice). Treatment started 2 weeks post bone metastasis initiation. P-value: ANOVA; Tukey’s multiple comparisons test. H- Similar to panel g, using MCF7 as bone metastasis model. (ALN-treated; n=11 mice) and anti-Her2 (Tras-ALN; n=12 mice). Treatment started 2 weeks post bone metastasis initiation. P-value: ANOVA; Tukey’s multiple comparisons test. I- μCT images illustrating tumor-mediated bone loss in mice. J- Dot plots showing bone volume changes in tumor-bearing femurs based on μCT images. Each dot represents a mouse. Representative samples for ZR75-1 (N=14) and MCF7 (N=7). P-value: unpaired two-tailed t-test (P<0.05: significant).
Figure 3:
Figure 3:. Mesenchymal Stem Cells (MSCs) induce Her2 expression in HR+/Her2− bone metastasis models of breast cancer.
A- Immunostaining of Her2 in primary tumors and bone metastasis models of ZR75-1 and HCI011. Scale bars: 100μm. B- FISH analysis of Her2 in control and bone-derived MCF7. scale bars, 50μm. C- TRAP-sequencing analysis of ERBBs’ expression in MCF7 organoids in monoculture or coculture with MSCs. D- Effect of ER ligands on ERBB2 mRNA expression in MCF7 monoculture (MSC-) or coculture (MSC+). E2 (Estradiol), ICI (fulvestrant), 4OHT(4-hydroxy-tamoxifen). P-values: two-tailed student t-test. Error bars: mean +/− SD. The linear curve represents the Log10(P-value) in each treatment condition. E- Diagraph depicting the experimental approach used to assess the response of bone metastases to Her2 inhibitors after two weeks of estrogen depletion and fulvestrant pre-treatment. F- Representative images showing the response of IIA-induced bone metastasis to anti-Her2 therapy following a fulvestrant pretreatment. Treatment groups: Alendronate (ALN), Trastuzumab (Tras), antibody conjugate (Tras-ALN), and control (PBS). G- Response of fulvestrant-resistant tumors to vehicle (PBS), Alendronate (ALN), Trastuzumab (Tras), bone-targeting Trastuzumab (Tras-ALN). Error bars: mean +/− Standard Error (SE). BLI is based on whole mouse imaging. Significant P-value < 0.05. H- Area Under Curve (AUC) analysis of metastasis growth in Alendronate (ALN), Trastuzumab (Tras), and bone-targeting Trastuzumab (Tras-ALN), relatively to the control group (PBS). Significant P-value < 0.05. I- Proportion of mice with multi-organ metastasis. Control (n=10), Tras (n=9), Tras-ALN (n=9), ALN (n=10). P-value: Fisher’s exact test. J- Representative immunostaining of metastatic lesions in ovaries from all treatment conditions based on Cytokeratin 19 (K19). Scale bars: 1mm for whole tissue scans and 500um for magnified areas.
Figure 4:
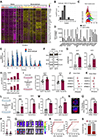
Figure 4:. Bone-mediated Her2E cells are transcriptionally different from pre-existing Her2E cells.
A- Heatmap representing the top differentially expressed genes in all cell clusters identified from naïve and bone-derived MCF7 cells based on single-cell RNA-seq. The data was deposited under GSE230612. B- Bar plot based on MYC-signature significance (P-value) in major cell states (UMAP, Resolution: 0.4) identified from single-cell RNA-seq. C- Ridge plot showing Her2-signaling scores in major cell states. Clusters are indicated as C0 to C7. D- Gene expression analysis of bone-associated genes identified from scRNA-seq analysis following Her2 overexpression in MCF7 (GSE111246). Significant P-values are shown as *(<0.05), **(<0.01), and ***(<0.001). E- Violin plot representing neuregulin 3 (NRG3) expression in different cell states. Differential expression between Naïve (red) and bone-derived (blue) MCF7 cells is significant for most clusters. P-values from cluster 0 to 7 are: P0<2e-16, P1<2e-16, P2<2e-16, P3=3.9e-14, P4=4.2e-15, P5=1.2e-0.7, P6=0.028, P7=0.133. F- Western blot showing the effect of NRG3 on heterodimerization-mediated Her3 phosphorylation (p-Her3) in cancer cells following a 4-hour exposure. G- Bar plots based on quantitative level of p-Her3 relatively to total Her3, following MCF7 and SCP2 exposure to NRG3. H- Time course analysis of p-Her3 expression under NRG3 treatment. I- Experimental design and histograms showing quantitative phospo-Her3 level relatively to total Her3 in naïve (MCF7 and SCP2) and bone-derived MCF7 (Bo-MCF7 and Bo-SCP2) cells. J,K- Forest plots depicting the risks of breast cancer relapse based on the mRNA expression ratio (j) or the mean expression (k) of indicated paired genes. Hazard ratios are plotted with a 95% confidence interval. L,M- Experimental design and actin normalized densitometry analyses of Her2 and pS6K expression in naïve and bone-derived models of HR+/Her2− breast cancer. N,O- Representative PLA images showing Her2/Her3 heterodimerization in CTCs collected from bone metastasis-bearing mice (N), or MCF7 treated with 100ng/ml NRG3 for 24h (O). P- Dot plot showing the mean expression of neuregulins (NRGs) in breast cancer patient-derived CTCs and metastatic lesions. Each dot represents a sample. Data was analyzed from GSE113890. P-value: two-tailed paired t-test. Q- Representative Bioluminescence images at day 0 and 49 following intra-cardiac (IC) injection of control MCF7 or NRG3 shRNA (sh16 and sh72) cells. R- Area under curve analysis of metastasis progression in NRG3 depleted conditions relatively to control mice. Control mice (n=9), sh16 (n=8), sh72 (n=8). S- Bar plot showing the percentage of mice with multiorgan metastasis (MoM) in control (n=9) and NRG3-depleted conditions (n=16).
Figure 5:
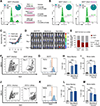
Figure 5:. Her2E cells are not required for BM initiation from naïve cells
A- Fluorescence-activated cell sorting analysis of MCF7 cells based on Her2 expression (Low, Medium, and High). N= number of events (cell count) for each group. Cells were seeded in 5 cm dishes for expansion. The percentage of detectable colonies over the seeded cells is shown in parathesis. B- Flow analysis of expended MCF7 Low and Medium cells based on Her2 expression. The pie plots represent the proportion of Her2 Low, Medium, and High from Her2-sorted sublines (N: 4 biological samples from 2 independent experiments). P-values (two-tailed Student’s t-test) comparing Her2 distribution in MCF7-Low vs MCF7-Med: P=0.1306 (Low vs Low), P=0.0983 (Med vs Med), P= 0.2424 (High vs High). C- Cell proliferation analysis of Her2-Low and Her2-Med MCF7 cells based on BLI in 2D. d- Representative BLI images of bone metastasis-bearing mice post-IIA injection. E- Assessment of multiorgan metastasis (MoM) in control MCF7 (Parental cells), Her2-Low, and Her2-Med 8–10 weeks post IIA injection; (n=5 mice per group). P-value: Fisher’s exact test. F- Flow analysis of Her2E cells in naïve and bone marrow (BMa)-derived MCF7 at day 3 post-IIA injection. G- Ridge plot showing Her2 expression in naïve and MCF7-derived DTCs at day 3 post-IIA. H-I: Percentage of Her2E cells in DTCs collected from bone marrow (BMa) or bone matrix at day 3 and 14 post IIA-mediated bone metastasis initiation; (n=3 mice per group). P-value: Two-tailed Student’s t-test. J-M: Flow analysis of Her2E cells in naïve and BMa-derived ZR75-1 cells (J). Ridge plot showing Her2 expression in naïve and ZR75-1-derived DTCs at day 3 post-IIA (K). Percentage of Her2E cells in DTCs derived from BMa and bone matrix at day 3 and 14 post-IIA injection (I-M); (n=3 mice per group). P-value: Two-tailed Student’s t-test.
Figure 6:
Figure 6:. Her2 contributes to visceral metastasis seeding.
A- Ex vivo bioluminescence imaging of visceral organs following IC injection of MCF7 cells with Her2 overexpression (Her2-OE), or Her2 depletion (sh53, sh78, ShA, and ShB). Organs were harvested 3 to 4 months post-injection. B- Bar plot depicting visceral metastasis distribution in control, Her2-OE, and Her2-targeting shRNA groups, based on ex vivo imaging. Control (n=8), Her2-OE (n-5), sh53 and sh78 (n=4 and n=3, respectively), shA (n=5), and shB (n=4). C- Proportion of multiorgan metastasis in mice injected with control MCF7 (n=8), Her2-OE (n=5), and shRNAs (n=16). P-value: Fisher’s exact test. D- Impact of Her2 genetic modulation on lung and ovary metastasis from MCF7. E- Proportion of multiorgan metastasis in mice injected with control ZR75-1 (n=5), Her2-OE (n=5), and shRNAs (n=12). P-value: Fisher’s exact test. F- Impact of Her2 genetic modulation on kidney (including the adrenal cortex) and lung metastases from ZR75-1.
Figure 7:
Figure 7:. Involvement of miRNAs in bone-mediated Her2 expression
A- Gene set enrichment analysis (GSEA) of mir-133a/b, miR-125b, and Let-7c pathway enrichment in naïve (MSC-) and MSC cocultured MCF7 cells (MSC+). Normalized enrichment score (NES) is significant if the FDR q-value <0.05. Only significant NES (FDR, q<0.02) are presented. B- Bar plot summarizing the association of bone-inhibited Her2-targeting miRNAs with overall survival (OS) in breast cancer (METABRIC). A total of 726 HR+ and endocrine-treated breast cancer patients were analyzed. Significant P-value (Log-Rank <0.05). C- Experimental design indicating the origin of metastatic and CTC samples from breast cancer patients with distant metastases (GSE113890). 8/14 specimens derive from BM+ MBC patients. D- Bar plots showing the distribution of positive (EXP+) and negative (EXP-) specimens based on miRNA detection. Specific miRNAs are annotated on each graph. (N=14); Significant P-value <0.05; two-sided Fisher’s exact test. E- Heatmap showing miRNA expression in prostate primary lesions (PCa) and metastasis to bone (BM) (GSE230278). F- Bar plots showing the distribution of positive (EXP+) and negative (EXP-) specimens based on miRNA detection in primary prostate cancer (PCa) and bone metastasis (BM). G- Dot plots showing miRNA expression in primary prostate cancer (PCa) and bone metastasis (BM). Significant P-value <0.05; two-tailed Mann-Whitney U-test. H- Representative ex vivo bioluminescence imaging (BLI) of brain metastases following IC injection of control (negative mimics) or miR-133a/b mimic-treated bone-derived ZR75-1 (Bo-ZR75-1) models. Representative whole mouse images at day 0 post-IC are shown. I- Percentage of brain metastasis in control and miR-133a/b mimic-treated groups (n=4 mice per group). J, K: Ex vivo BLI of lung metastases post-IC injection of control (negative mimics) or miR-133a/b mimic-treated bone-derived MCF7 (Bo-MCF7) models. Bar plot showing the impact of miR-133a/b on lung metastasis formation (K); (n=5 mice per group). L, M: Similar to panel “J and K’ using bone-derived SCP2 (Bo-SCP2); (n=5 mice per group). For I, K, and M: P-value = ‘N-1’ Chi-squared test. N- Summary graph depicting key mechanistic insights associated with acquired Her2 expression in bone and contributing to secondary metastasis. While cell-cell interaction may contribute to mTOR activation in the osteogenic niche (51), we demonstrate how the bone-mediated NRG3/Her2/Her3 axis facilitates CTC seeding in visceral organs. Pharmacological blockade of Her2 using bone-targeting Trastuzumab (Tras-ALN) impedes Her2E CTC dissemination from bone to visceral organs.

References

    1. Paterson AHG, Anderson SJ, Lembersky BC, Fehrenbacher L, Falkson CI, King KM, et al. Oral clodronate for adjuvant treatment of operable breast cancer (National Surgical Adjuvant Breast and Bowel Project protocol B-34): A multicentre, placebo-controlled, randomised trial. Lancet Oncol 2012;13:734–42. - PMC - PubMed
    1. Gnant M, Mlineritsch B, Stoeger H, Luschin-Ebengreuth G, Knauer M, Moik M, et al. Zoledronic acid combined with adjuvant endocrine therapy of tamoxifen versus anastrozol plus ovarian function suppression in premenopausal early breast cancer: Final analysis of the Austrian Breast and Colorectal Cancer Study Group Trial 12. Annals of Oncology 2015;26:313–20. - PubMed
    1. Von Minckwitz G, Möbus V, Schneeweiss A, Huober J, Thomssen C, Untch M, et al. German adjuvant intergroup node-positive study: A phase III trial to compare oral ibandronate versus observation in patients with high-risk early breast cancer. Journal of Clinical Oncology 2013;31:3531–9. - PubMed
    1. Coleman R, Powles T, Paterson A, Gnant M, Anderson S, Diel I, et al. Adjuvant bisphosphonate treatment in early breast cancer: meta-analyses of individual patient data from randomised trials. Lancet. Early Breast Cancer Trialists’ Collaborative Group (EBCTCG). Open Access article distributed under the terms of CC BY; 2015;386:1353–61. - PubMed
    1. Coleman R, De Boer R, Eidtmann H, Llombart A, Davidson N, Neven P, et al. Zoledronic acid (zoledronate) for postmenopausal women with early breast cancer receiving adjuvant letrozole (ZO-FAST study): Final 60-month results. Annals of Oncology 2013;24:398–405. - PubMed