. 2025 Jan 28;122(4):e2419985122.
doi: 10.1073/pnas.2419985122. Epub 2025 Jan 21.

Dispersal of influenza virus populations within the respiratory tract shapes their evolutionary potential

Affiliations

Dispersal of influenza virus populations within the respiratory tract shapes their evolutionary potential

Lucas M Ferreri et al. Proc Natl Acad Sci U S A. .

Abstract

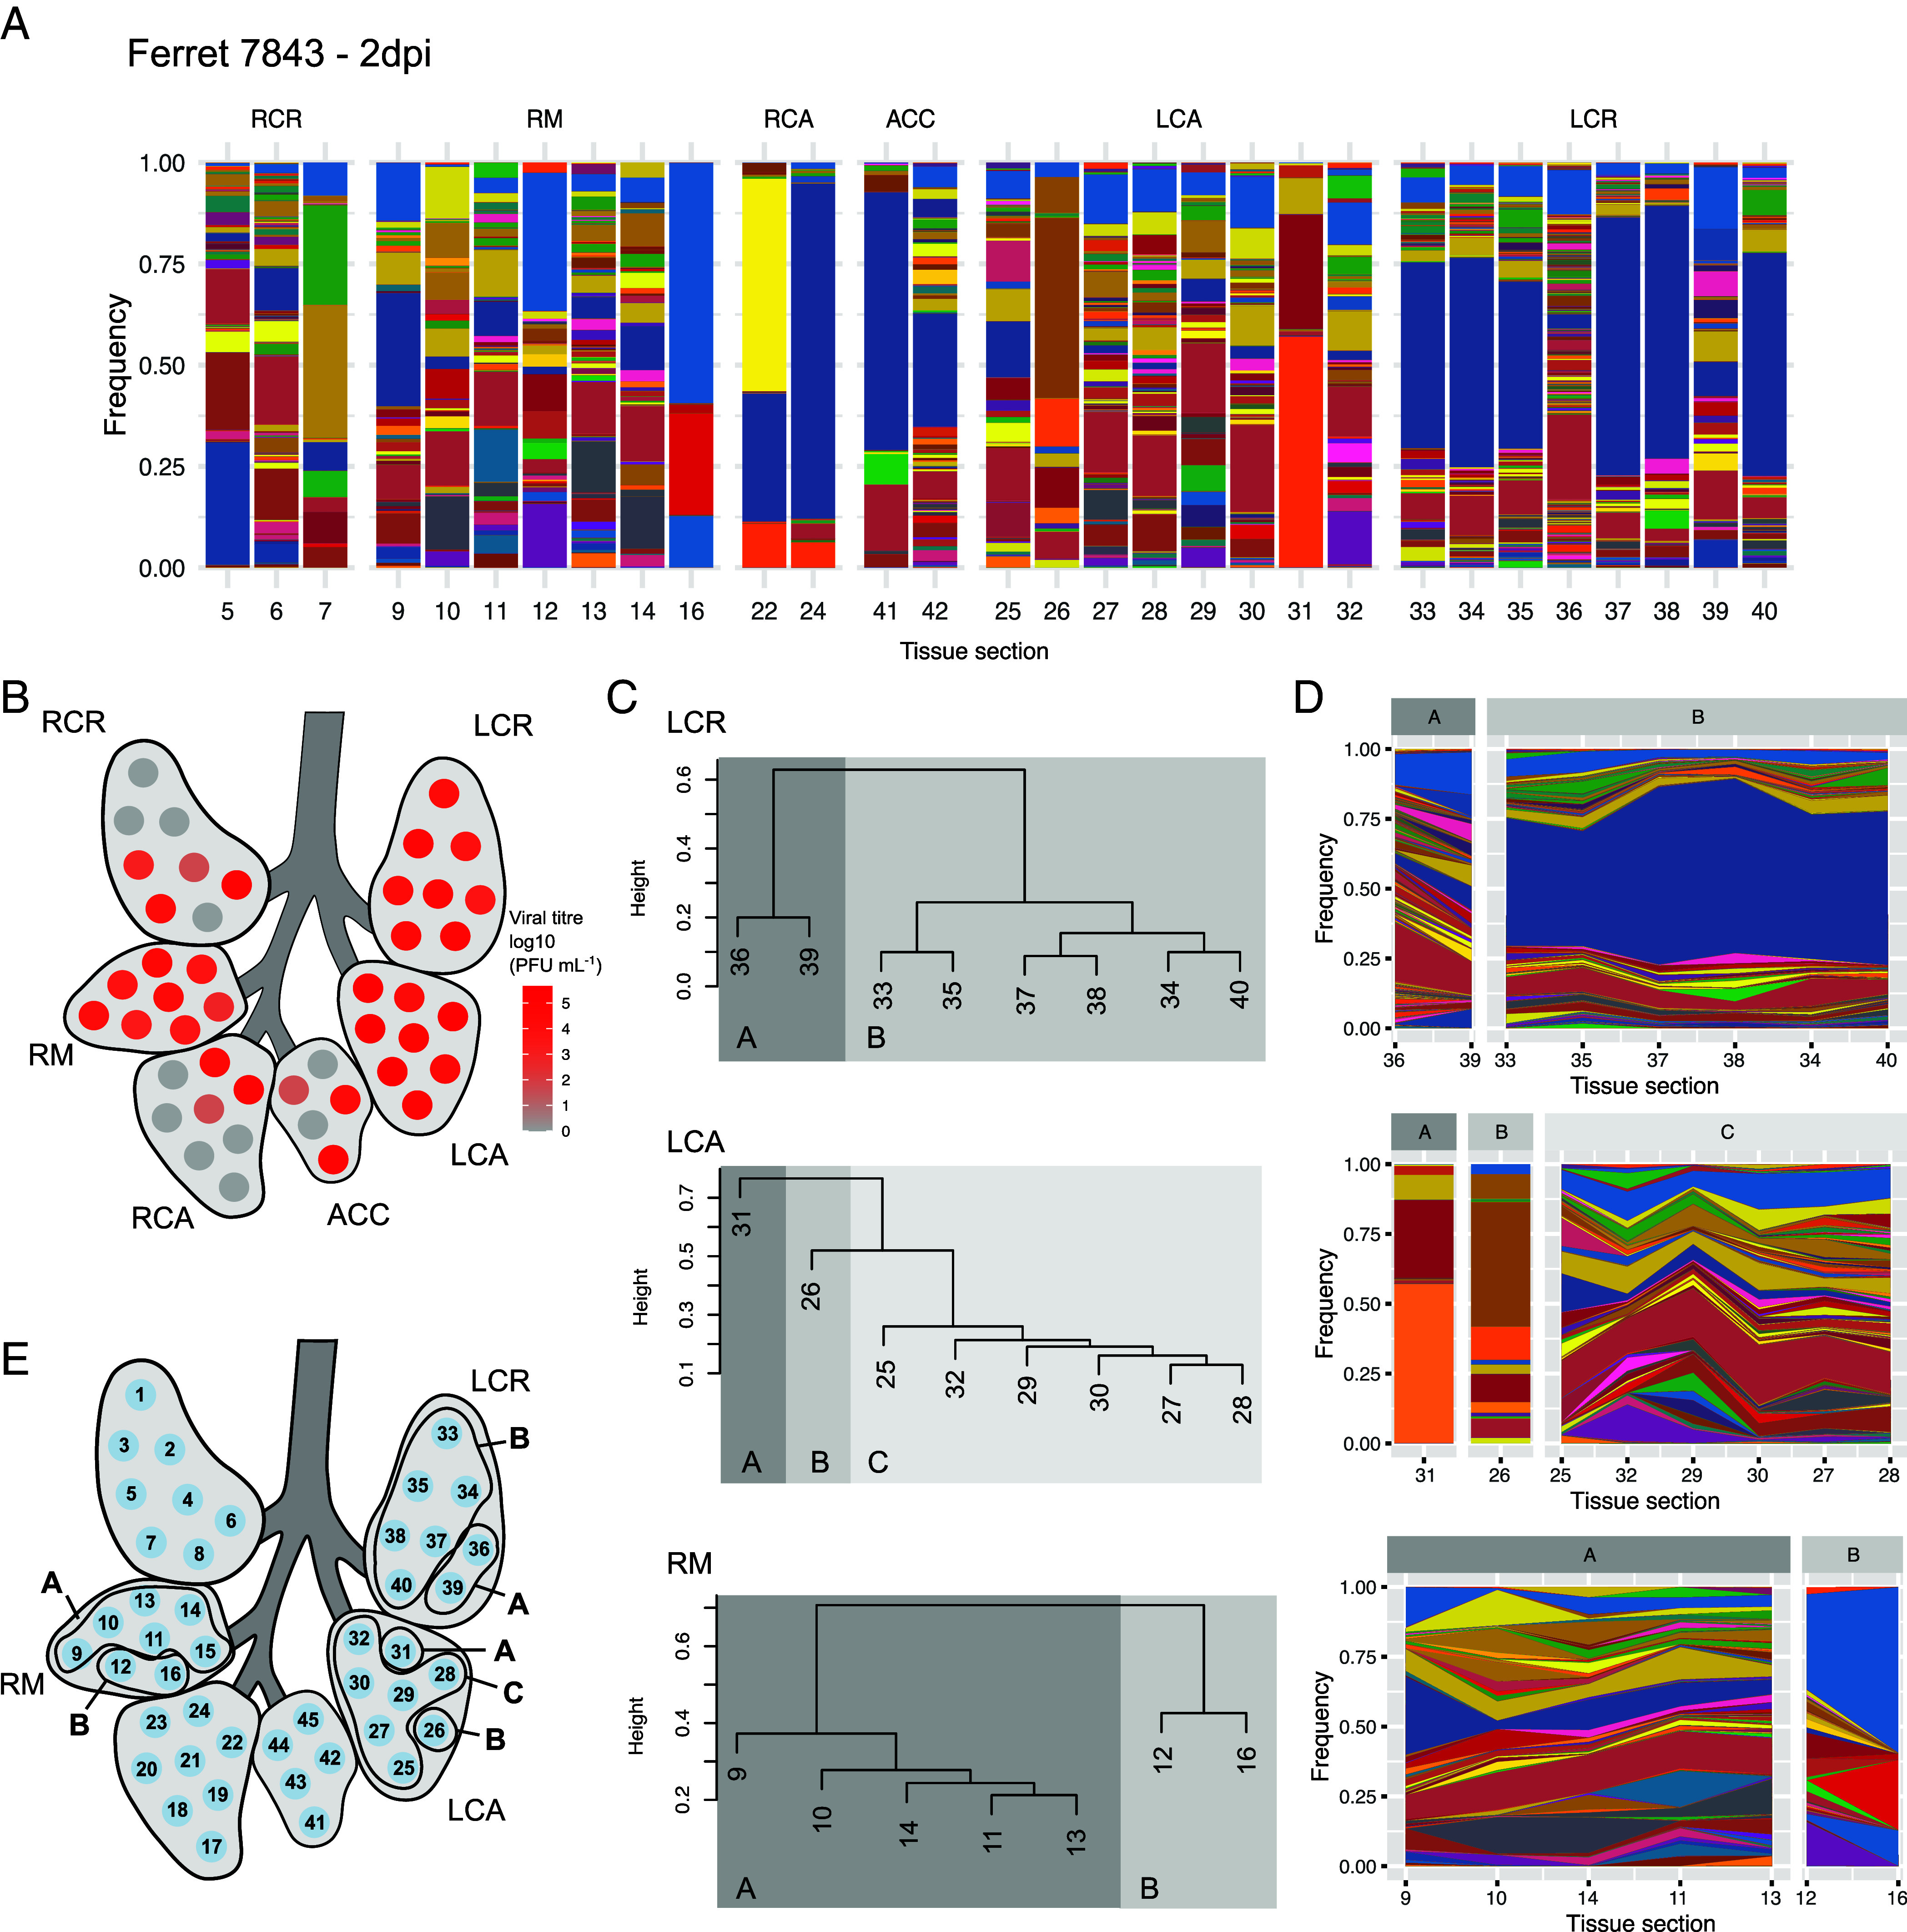
Viral infections are characterized by dispersal from an initial site to secondary locations within the host. How the resultant spatial heterogeneity shapes within-host genetic diversity and viral evolutionary pathways is poorly understood. Here, we show that virus dispersal within and between the nasal cavity and trachea maintains diversity and is therefore conducive to adaptive evolution, whereas dispersal to the lungs gives rise to population heterogeneity. We infected ferrets either intranasally or by aerosol with a barcoded influenza A/California/07/2009 (H1N1) virus. At 1, 2, or 4 days postinfection, dispersal was assessed by collecting 52 samples from throughout the respiratory tract of each animal. Irrespective of inoculation route, barcode compositions across the nasal turbinates and trachea were similar and highly diverse, revealing little constraint on the establishment of infection in the nasal cavity and descent through the trachea. Conversely, infection of the lungs produced genetically distinct viral populations. Lung populations were pauci-clonal, suggesting that each seeded location received relatively few viral genotypes. While aerosol inoculation gave distinct populations at every lung site sampled, within-host dispersal after intranasal inoculation produced larger patches, indicative of local expansion following seeding of the lungs. Throughout the respiratory tract, barcode diversity declined over time, but new diversity was generated through mutation. De novo variants were often unique to a given location, indicating that localized replication following dispersal resulted in population divergence. In summary, dispersal within the respiratory tract operates differently between regions and contributes to the potential for viral evolution to proceed independently in multiple within-host subpopulations.

Keywords: dispersal; evolution; influenza virus.


Conflict of interest statement

Competing interests statement:The authors declare no competing interest.

Figures

Fig. 1.
Fig. 1.
Experimental design for capturing spatial distribution of virus populations. (A) Extensive sampling of infected ferrets included division of nasal turbinates into rostral (R) and caudal (C) sections, division of trachea into five sections (1 to 5) and collection of 45 sections across the six lung lobes: right cranial (RCR), right middle (RM), right caudal (RCA), accessory (ACC), left caudal (LCA), and left cranial (LCR). (B) Two different inoculation techniques were used, intranasal and aerosol. (C) Samples were collected at 1, 2, and 4 dpi.
Fig. 2.
Fig. 2.
Distribution of viral populations in the lungs of intranasally inoculated ferrets. (A) Infectious viral titers detected in tissue samples. Tissue type is identified at the Top of the panel and sections within each tissue are identified at the Bottom. Dark gray bars depict positive samples, and light gray bars show results under the limit of detection (50 PFU). NT = nasal turbinate; T = trachea. Lung lobes are designated as RCR = right cranial; RM = right middle; RCA = right caudal; ACC = accessory; LCA = left caudal; LCR = left cranial. Numbers on the secondary y-axis show ferret identification numbers. Time of sampling is shown at the extreme right (dpi = days postinoculation). (B) Violin plots show virus titers in the different anatomical sites. The line within the violin represents the mean value. Points show individual values.
Fig. 3.
Fig. 3.
In intranasally inoculated ferrets, dispersal to the trachea is unconstrained and seeds a similar population throughout the organ. (A) Barcode frequencies detected in the rostral (R) and caudal (C) sections of the nasal turbinates and sections 1 to 5 in the trachea (1 to 5) of four ferrets sampled at 1 d postinoculation. Different colors represent unique barcodes. NA = not applicable; sequencing data are not available from these samples. (B) Barcode counts detected in nasal turbinates and trachea. (C) Dissimilarity relationships between the rostral, caudal, and the remaining sections of the trachea. Dissimilarity was calculated using the Bray–Curtis dissimilarity index.
Fig. 4.
Fig. 4.
Expansion produces divergent populations in the lung lobes. All data shown are derived from intranasally inoculated ferret 7843, from which tissues were harvested at 2 d postinoculation. Related data from additional animals are found in SI Appendix, Fig. S2. (A) Distribution of barcodes within the lung. (B) Distribution of infectious virus in the lung. (C) Relationships among sampled viral populations as assessed by hierarchical clustering of barcode compositions. Height shows distance between clusters. (D) Continuity of barcodes within clusters identified in C. (E) Spatial relationship of clusters within each lung lobe. RCR = right cranial; RM = right middle; RCA = right caudal; ACC = accessory; LCA = left caudal; LCR = left cranial.
Fig. 5.
Fig. 5.
Barcode diversity declines over infection. (A) Barcode detection in nasal turbinates (NT) and trachea. (B) Shannon diversity in the nasal turbinates, trachea, and lung. *P = 2.00e-03 comparing 1 and 4 dpi; **P = 3.66e-04 comparing 1 and 4 dpi; ***P = 4.77e-15 (comparing 2 and 4 dpi, due to the paucity of positive samples at 1 dpi). NA = not applicable. (C) Viral titers in nasal turbinate and tracheal sections. “R” = rostral section, “C” = caudal section. In the boxplots, the central line represents the median, the box edges represent the first and third quartiles (Q1 and Q3), and the whiskers extend to the smallest and largest values within 1.5 times the interquartile range (IQR) from Q1 and Q3. *P = 7.77e-08; **P = 1.48e-04; ***P = 1.73e-04.
Fig. 6.
Fig. 6.
De novo mutations differentiate populations within tissues. (A) Minor variants detected across the respiratory tract of intranasally inoculated ferrets presenting extensive lung infection. Those designated as Unique (diamonds) were observed in only one tissue section. Those labeled as Common (inverted triangles) were observed in at least two sections. Variants comprising the introduced barcodes are not displayed. (B) Average number of variants per tissue section. (C) Raup–Crick dissimilarity index comparing lung sections in ferret 7843. Raup–Crick dissimilarity index was calculated without considering the barcode region.
Fig. 7.
Fig. 7.
Dispersed viral delivery through aerosols seeds diverse, unique populations. (A) Virus titers in the NT and tracheas of ferrets 2229, 2233, and 2234, sampled at 1 dpi. (B) Barcode detection in the NT and tracheas of ferrets 2229, 2233, and 2234. (C) Virus titers in the lung lobes of ferret 2230, sampled at 1 dpi. (D) Barcode composition by tissue section for the lung lobes LCA and LCR of ferret 2230. (E) Distance matrices of barcode frequencies were used to evaluate genetic relationships by hierarchical clustering. (F) Stacked plots organized according to the genetic relationships identified by hierarchical clustering for left caudal (LCA) and left cranial (LCR) lobes of ferret 2230. Related data (AF) from additional animals are found in SI Appendix, Figs. S5–S7. (G) Shannon diversity in nasal turbinates, trachea, and lungs. Comparison between 1 and 4 dpi: *P = 7.56e-4; **P = 7.02e-4; ***P = 6.04e-11. (H) Shannon diversity comparison between 1 dpi aerosol inoculated ferrets and 2 dpi intranasally inoculated ferrets. In the boxplots, the central line represents the median, the box edges represent the first and third quartiles (Q1 and Q3), and the whiskers extend to the smallest and largest values within 1.5 times the IQR from Q1 and Q3. (I) Comparison of the number of variants detected in ferrets inoculated intranasally (IN) or via aerosols (AE). *P = 0.023; **P = 0.030. The number in facets shows dpi.

References

    1. Manicassamy B., et al. , Analysis of in vivo dynamics of influenza virus infection in mice using a GFP reporter virus. Proc. Natl. Acad. Sci. U.S.A. 107, 11531–11536 (2010). - PMC - PubMed
    1. Karlsson E. A., et al. , Visualizing real-time influenza virus infection, transmission and protection in ferrets. Nat. Commun. 6, 6378 (2015). - PMC - PubMed
    1. Gallagher M. E., Brooke C. B., Ke R., Koelle K., Causes and consequences of spatial within-host viral spread. Viruses 10, 627 (2018). - PMC - PubMed
    1. Fukuyama S., et al. , Multi-spectral fluorescent reporter influenza viruses (Color-flu) as powerful tools for in vivo studies. Nat. Commun. 6, 6600 (2015). - PMC - PubMed
    1. Zwart M. P., Elena S. F., Matters of size: Genetic bottlenecks in virus infection and their potential impact on evolution. Annu. Rev. Virol. 2, 161–179 (2015). - PubMed

LinkOut - more resources