. 2025 Jan 2;66(1):48.
doi: 10.1167/iovs.66.1.48.

Safety of Human USH1C Transgene Expression Following Subretinal Injection in Wild-Type Pigs

Affiliations

Safety of Human USH1C Transgene Expression Following Subretinal Injection in Wild-Type Pigs

Peter Kiraly et al. Invest Ophthalmol Vis Sci. .

Abstract

Purpose: This study aimed to evaluate early-phase safety of subretinal application of AAVanc80.CAG.USH1Ca1 (OT_USH_101) in wild-type (WT) pigs, examining the effects of a vehicle control, low dose, and high dose.

Methods: Twelve WT pigs (24 eyes) were divided into three groups: four pigs each received bilateral subretinal injections of either vehicle, low dose (3.3 × 10¹⁰ vector genomes [vg] per eye), or high dose (1.0 × 10¹¹ vg per eye). Total retinal thickness (TRT) was evaluated using optical coherence tomography and retinal function was assessed with full-field electroretinography (ff-ERG) at baseline and two months post-surgery. After necropsy, retinal changes were examined through histopathology, and human USH1C_a1/harmonin expression was assessed by quantitative PCR (qPCR) and Western blotting.

Results: OT_USH_101 led to high USH1C_a1 expression in WT pig retinas without significant TRT changes two months after subretinal injection. The qPCR revealed expression of the human USH1C_a1 transgene delivered by the adeno-associated virus vector. TRT changes were minimal across groups: vehicle (256 ± 21 to 243 ± 18 µm; P = 0.108), low dose (251 ± 32 to 258 ± 30 µm; P = 0.076), and high dose (242 ± 24 to 259 ± 28 µm; P = 0.590). The ff-ERG showed no significant changes in rod or cone responses. Histopathology indicated no severe retinal adverse effects in the vehicle and low dose groups.

Conclusions: Early-phase clinical imaging, electrophysiology, and histopathological assessments indicated that subretinal administration of OT_USH_101 was well tolerated in the low-dose treatment arm. OT_USH_101 treatment resulted in high expression of human USH1C_a1. Although histopathological changes were not severe, more frequent changes were observed in the high-dose group.


Conflict of interest statement

Disclosure: P. Kiraly, None; J. Klein, None; I.P. Seitz, None; F.F. Reichel, None; T. Peters, None; T. Ardan, None; J. Juhasova, None; S. Juhás, None; Z. Ellederova, None; Y. Nemesh, None; R. Nyshchuk, None; N. Klymiuk, None; K. Nagel-Wolfrum, None; A.R. Winslow, None; U. Wolfrum, None; J. Motlik, None; M.D. Fischer, None

Figures

Figure 1.
Figure 1.
Schematic representation of the design of the OT_USH_101 adeno-associated viral vector.
Figure 2.
Figure 2.
Optical section through the visual streak of the treated WT pig retina. On the left: Scanning Laser Ophthalmoscopy (SLO) image showing the placement of the B-scan. On the right: Optical coherence tomography (OCT) B-scan with the marked area for analysis.
Figure 3.
Figure 3.
Anatomical location of the raised subretinal bleb (blue) related to the vascular system (black lines) and the optic nerve head (yellow) after subretinal administration of the vector targeting the visual streak of all 24 WT pig eyes.
Figure 4.
Figure 4.
Intraoperative image of a raised subretinal bleb by subretinal injection of the vector and the anatomical location of the bleb (blue) within the visual streak of the right eye from animal B417.
Figure 5.
Figure 5.
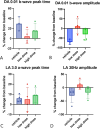
Percentage changes in ERG readings from baseline (before surgery) to two months post-surgery. Top panels (A, B) show analysis of rod-dominated responses (dark-adapted 0.01 cd/m2) ERG: Percentage changes in b-wave peak time (A) and amplitude (B) between baseline and two months indicate no global toxicity to rod photoreceptors in either treatment group with the vehicle group performing worst (increase in peak time and loss of amplitude). Bottom panels (C, D) display cone-dominated responses: Percentage changes in a-wave peak time (C) following a single flash (light-adapted 3.0 cd/m2) ERG and percentage changes in amplitude (D) in the light-adapted 30 Hz flicker at 3 cd/m2 between baseline and two months, showing no global toxicity to the cone photoreceptor population in either treatment group.
Figure 6.
Figure 6.
Wide field microscopy images of treated areas of WT pig retinas. No retinal changes suggestive of toxicity or inflammation were observed in the histopathological analysis in a WT pig in the vehicle group (A, pig B449) and the low dose group (B, pig B417). In the high dose group, pigmentary clumps (red arrows), atrophy of the outer retinal layers (blue arrow), and rosettes (yellow arrows) were seen in pig B416 (C).
Figure 7.
Figure 7.
Expression analysis of porcine Gapdh, porcine Ush1c, and human USH1C mRNA in wild type porcine retinas after application of vehicle (blue) and vectors at low (red) and high (green) doses. (A) QPCR analysis of mRNA expression of porcine Gapdh in the non-treated (non-bleb) compared to treated (bleb) areas of retinas. (B) QPCR analysis of mRNA expression of porcine Ush1c in the non-treated (non-bleb) compared to treated (bleb) areas of retinas. (C) QPCR analysis of mRNA expression of human USH1C in the non-treated (non-bleb) compared to treated (bleb) areas of retinas. Significant differences were observed only as increases in transgenic human USH1C mRNA expression following low dose treatment (two-way analysis of variance; *** P < 0.001; ** P = 0.005).
Figure 8.
Figure 8.
USH1C/harmonin protein expression analysis of porcine retinas after application of vehicle (blue) and vectors at low (red) and high (green) doses. (A) Representative anti-harmonin Western blot of protein lysates from the non-treated (non-bleb) areas of porcine retinas; lower bar plot: quantification of anti-harmonin bands relative to the anti-actin loading control bands in three Western blots from three porcine retinas from different animals. (B) Representative anti-harmonin Western blot of protein lysates from the treated (bleb) areas of porcine retinas; lower bar plot: quantification of anti-harmonin bands relative to the anti-actin loading control bands in three Western blots from three porcine retinas from different animals. No significant increase in harmonin protein expression was observed in the non-treated (non-bleb) and treated (bleb) areas of retinas treated with low and high vector doses (one-way analysis of variance, ns = not significant).
Figure 9.
Figure 9.
Pilot study proving USH1C/harmonin expression after subretinal injection of OT_USH_101. (A) qPCR comparing the endogenous Ush1c and ectopic USH1C expression in the non-bleb and bleb areas. (B) Anti-harmonin Western blot of protein lysates from the non-bleb and bleb areas of AM59 with WT porcine retina as a control. Lower bar plot: Quantification of anti-harmonin bands relative to the anti-actin loading control bands.
Figure 10.
Figure 10.
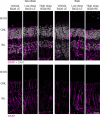
Immunohistochemical analysis of gliosis by immunostaining for GFAP (magenta) in WT porcine retinas after application of vehicle and vectors at low and high doses. Upper part: sections was counterstained for nuclear DNA in the outer nuclear layer (ONL) and inner nuclear layer (INL) with DAPI (gray). Lower part: Single GFAP channel for better visualization of the GFAP expression. IS, inner segment; OS, outer segment. Scale bars: 20 µm.
Figure 11.
Figure 11.
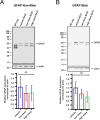
GFAP expression analysis by Western blots of porcine retinas after application of vehicle (blue) and vectors at low (red) and high (green) doses. (A) Representative anti-GFAP Western blot of protein lysates from the non-treated (non-bleb) areas of porcine retinas; lower bar plot: quantification of anti-GFAP bands relative to the anti-actin loading control bands from three Western blots of three porcine retinas from different animals. (B) Representative anti-GFAP Western blot of protein lysates from the treated (bleb) areas of porcine retinas; lower bar plot: quantification of anti-GFAP bands relative to the anti-actin loading control bands of three Western blots of three porcine retinas from different animals. No significant differences in GFAP protein expression were found in the non-treated (non-bleb) areas (one-way analysis of variance) or in the treated (bleb) areas (Kruskal-Wallis test). Numbers on Western blots represent molecular weight markers in kDa. ns, not significant.

References

    1. Millán JM, Aller E, Jaijo T, Blanco-Kelly F, Gimenez-Pardo A, Ayuso C.. An update on the genetics of usher syndrome. J Ophthalmol. 2011; 2011: 417217. - PMC - PubMed
    1. Vernon M. Usher's syndrome–deafness and progressive blindness. Clinical cases, prevention, theory and literature survey. J Chronic Dis. 1969; 22: 133–151. - PubMed
    1. Boughman JA, Vernon M, Shaver KA.. Usher syndrome: definition and estimate of prevalence from two high-risk populations. J Chronic Dis. 1983; 36: 595–603. - PubMed
    1. Marazita ML, Ploughman LM, Rawlings B, Remington E, Arnos KS, Nance WE. Genetic epidemiological studies of early-onset deafness in the U.S. school-age population. Am J Med Genet. 1993; 46: 486–491. - PubMed
    1. Delmaghani S, El-Amraoui A.. The genetic and phenotypic landscapes of Usher syndrome: from disease mechanisms to a new classification. Hum Genet. 2022; 141(3-4): 709–935. - PMC - PubMed

Substances