. 2025 Mar 17;31(6):1057-1068.
doi: 10.1158/1078-0432.CCR-24-3324.

CA-125 as a Biomarker in Renal Medullary Carcinoma: Integrated Molecular Profiling, Functional Characterization, and Prospective Clinical Validation

Affiliations

CA-125 as a Biomarker in Renal Medullary Carcinoma: Integrated Molecular Profiling, Functional Characterization, and Prospective Clinical Validation

Sandra L Grimm et al. Clin Cancer Res. .

Abstract

Purpose: Renal medullary carcinoma (RMC) is a highly aggressive malignancy defined by the loss of the SMARCB1 tumor suppressor. It mainly affects young individuals of African descent with sickle cell trait, and it is resistant to conventional therapies used for other renal cell carcinomas. This study aimed to identify potential biomarkers for early detection and disease monitoring of RMC.

Experimental design: Integrated profiling of primary untreated RMC tumor tissues and paired adjacent kidney controls was performed using RNA sequencing and histone chromatin immunoprecipitation sequencing. The expression of serum cancer antigen 125 (CA-125), was prospectively evaluated in 47 patients with RMC. Functional studies were conducted in RMC cell lines to assess the effects of SMARCB1 reexpression.

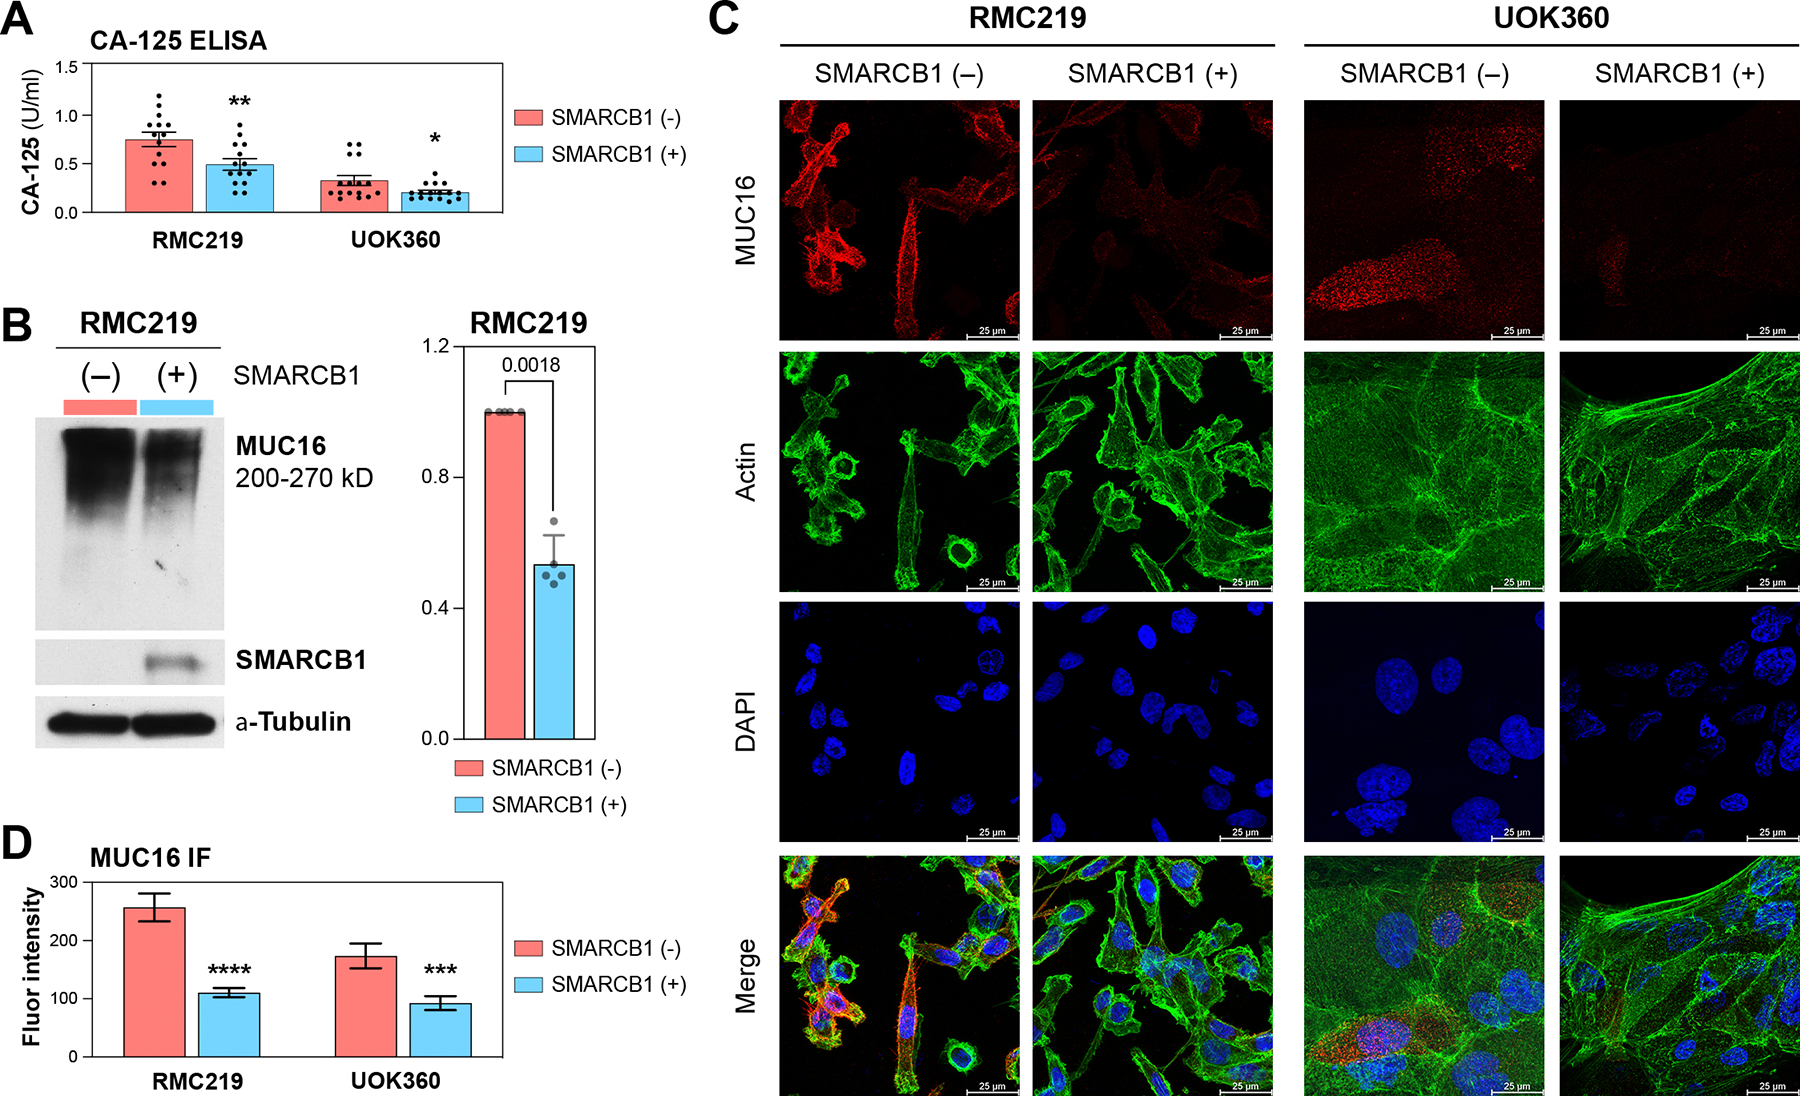
Results: MUC16, encoding for CA-125, was identified as one of the top upregulated genes in RMC tissues, with concomitant enrichment of active histone marks H3K4me3 and H3K27ac at its promoter. Elevated serum CA-125 levels were found in 31 of 47 (66%) patients with RMC and correlated significantly with metastatic tumor burden (P = 0.03). Functional studies in RMC cell lines demonstrated that SMARCB1 reexpression significantly reduced MUC16 expression.

Conclusions: The correlation between serum CA-125 levels and metastatic burden suggests that CA-125 is a clinically relevant biomarker for RMC. These findings support further exploration of CA-125 for disease monitoring and targeted therapeutics in RMC.


Figures

Figure 1.
Figure 1.. Integrated chromatin and transcriptomic profiling of RMC.
A. Tumor and adjacent normal tissue samples were collected from patients with RMC prior to treatment and used for RNA-Seq and ChIP-seq analysis. B. Bar plot with number of DEPs for each histone mark. C. Bar plot with number of differentially expressed genes (DEGs) that have a DEP within +/–10kb from the gene body. D. Bar plot with number of DEGs that have a DEP in an enhancer, as defined by Enhancer Atlas. E. Integrative Genome Viewer (IGV) tracks for three genes showing signal intensities for RNA-seq or ChIP-seq (H3K27ac or H3K4me3) reads comparing normal and tumor samples. Black lines under peaks indicate DEPs called by DiffReps. F. Schematic of the MUC16 protein structure, with the putative cleavage site indicated in red.
Figure 2.
Figure 2.. Prospective Evaluation of CA-125 in patients with RMC.
A. Measurements of serum markers from patients with RMC and healthy controls. Dotted line indicates upper threshold of normal range. B. CA-125 serum levels from RMC patient samples categorized by number of metastatic sites (left) with the correlation plot and 95% confidence interval (right). C. CA-125 levels and tumor burden measurements over time for patient RMC61. Systemic therapies (ST) are indicated below. D. CT scans of the tumor at the beginning of treatment (Day 0) and at Day 140 for patient RMC61. E. Immunohistochemistry (IHC) of representative RMC tissue sections using a CLIA-certified antibody against MUC16 (see Methods). Scale bar equals 100μm. F. Plots of peak CA-125 serum levels along with a histology H-score for MUC16 staining. G. Expression of MUC16 by RNA-seq for 11 patients used to stratify RMC tumors with high or low MUC16 gene expression. Arrows indicate samples used for ChIP-seq. H. Volcano plot showing number of DEGs comparing RMC tumors with high MUC16 over low MUC16 expression. I. Over-representation analysis (ORA) to identify enriched pathways from the Gene Ontology Biological Process compendium.
Figure 3.
Figure 3.. Expression of MUC16 and CA-125 in RMC cell lines.
A. Quantitation of CA-125 levels obtained by ELISA assay performed using the supernatants of four different RMC cell lines. Ovarian cell line (OVCAR3) supernatant was used as a positive control. 786-O, A-498 and HEK293FT supernatants were used as negative controls. Mean +/− SEM shown for N=8 samples per cell line (or 9 samples for each of the three negative control cell lines). B. Western blot (WB) showing the protein expression of MUC16 in various RMC cell lysates, with OVCAR3 as a positive control. Actin was used as a protein loading control. C. Quantification of WB via densitometric analysis normalized to β-Actin. D. Representative confocal immunofluorescence (IF) images of RMC cells lines and of OVCAR3 cell line showing cellular localization of MUC16 (red), actin (green), DAPI-stained nuclei (blue), and merged images. Scale bar= 25μm. E. Quantitation of fluorescent intensities of MUC16 from immunofluorescence images. Units are corrected total cell fluorescence (CTCF) intensity of MUC16 using ImageJ. Mean +/− SEM shown for N=40–133 fields per cell line.
Figure 4.
Figure 4.. MUC16 and CA-125 levels upon re-expression of SMARCB1 in RMC cell lines.
A. Quantitation of CA-125 levels obtained by ELISA assay performed using the supernatants collected after re-expression of SMARCB1 in two RMC cell lines. Mean +/− SEM shown for N=14–16 samples per group. B. Western blot showing MUC16 and SMARCB1 protein levels in RMC219 and UOK360 cells with or without re-expression of SMARCB1. Tubulin was used as a protein loading control. C. Representative confocal immunofluorescence images of RMC219 and UOK360 cells with or without re-expression of SMARCB1 showing cellular localization of MUC16 (red), actin (green), DAPI-stained nuclei (blue), and merged images. Scale bar = 25μm. D. Quantitation of fluorescent intensities of MUC16 from immunofluorescence images. Units are corrected total cell fluorescence (CTCF) intensity of MUC16 using ImageJ. Mean +/− SEM shown for N=85–137 fields per cell line. Asterisks indicate significance determined by p-value of <0.05 (*), <0.01 (**), <0.001 (***), or <0.0001 (****) using a Mann-Whitney t-test.
Figure 5.
Figure 5.. Integrated chromatin and transcriptomic profiling of MUC16 positive negative RMC cell lines.
A. RMC-derived cell lines used for RNA-seq and ChIP-seq. B. Volcano plot showing number of DEGs comparing cell line samples MUC16+ over MUC16. C. Bar plot with number of DEPs for each histone mark. D. Bar plot with number of DEGs that have a DEP in an enhancer, as defined by Enhancer Atlas. E. Over-representation analysis (ORA) to identify enriched pathways using a total of 4970 DEGs that had reprogrammed enhancers. Pathways are from the Gene Ontology Biological Process (GOBP) collection. F. Overlap of enriched GOBP pathways from MUC16 high over MUC16 low samples using either cell lines (turquoise) or RMC tumors (green). G. IGV tracks for MUC16 showing signal intensities for ChIP-seq (H3K27ac, H3K4me3, H3K4me1, H3K27me3) reads comparing RMC2C1 MUC16− and RMC219 MUC16+ cell lines. Lines under peaks indicate DEPs called up (black) or down (grey) by DiffReps.

References

    1. Msaouel P, Tannir NM, Walker CL. A Model Linking Sickle Cell Hemoglobinopathies and SMARCB1 Loss in Renal Medullary Carcinoma. Clin Cancer Res 2018;24(9):2044–9 doi 10.1158/1078-0432.CCR-17-3296. - DOI - PMC - PubMed
    1. Msaouel P, Hong AL, Mullen EA, Atkins MB, Walker CL, Lee CH, et al. Updated Recommendations on the Diagnosis, Management, and Clinical Trial Eligibility Criteria for Patients With Renal Medullary Carcinoma. Clin Genitourin Cancer 2019;17(1):1–6 doi 10.1016/j.clgc.2018.09.005. - DOI - PMC - PubMed
    1. Lebenthal JM, Kontoyiannis PD, Hahn AW, Lim ZD, Rao P, Cheng JP, et al. Clinical Characteristics, Management, and Outcomes of Patients with Renal Medullary Carcinoma: A Single-center Retrospective Analysis of 135 Patients. Eur Urol Oncol 2024. doi 10.1016/j.euo.2024.07.002. - DOI - PubMed
    1. Soeung M, Perelli L, Chen Z, Dondossola E, Ho IL, Carbone F, et al. SMARCB1 regulates the hypoxic stress response in sickle cell trait. Proc Natl Acad Sci U S A 2023;120(21):e2209639120 doi 10.1073/pnas.2209639120. - DOI - PMC - PubMed
    1. Msaouel P, Genovese G, Tannir NM. Renal Cell Carcinoma of Variant Histology: Biology and Therapies. Hematol Oncol Clin North Am 2023;37(5):977–92 doi 10.1016/j.hoc.2023.04.019. - DOI - PMC - PubMed

MeSH terms