. 2025 Jan 21;10(4):e182376.
doi: 10.1172/jci.insight.182376.

The impact of remdesivir on SARS-CoV-2 evolution in vivo

Affiliations

The impact of remdesivir on SARS-CoV-2 evolution in vivo

Ted Ling-Hu et al. JCI Insight. .

Abstract

The impact of remdesivir on SARS-CoV-2 diversity and evolution in vivo has remained unclear. In this single-center, retrospective cohort study, we assessed SARS-CoV-2 diversification and diversity over time in a cohort of hospitalized patients who did or did not receive remdesivir. Whole-genome sequencing was performed on 98 paired specimens collected from 49 patients before and after remdesivir administration. The genetic divergence between paired specimens was not significantly different in this cohort compared with that in a control group of patients who did not receive the drug. However, when we focused on minority variants, several positions showed preferential diversification after remdesivir treatment, some of which were associated with specific variants of concern. Most notably, remdesivir administration resulted in strong selection for a nonsynonymous mutation in nsp12, G671S, previously associated with enhanced viral fitness. This same mutation was found to be enriched in a second cohort of 143 inpatients with specimens collected after remdesivir administration compared with controls. Only one other mutation previously implicated in remdesivir resistance (nsp12:V792I) was found to be preferentially selected for after remdesivir administration. These data suggest that SARS-CoV-2 variants with enhanced replicative fitness may be selected for in the presence of antiviral therapy as an indirect means to overcome this selective pressure.

Keywords: COVID-19; Drug therapy; Therapeutics.


Conflict of interest statement

Conflict of interest: JFH has received research support, paid to Northwestern University, from Gilead Sciences and is a paid consultant for Merck and Ridgeback Biotherapeutics.

Figures

Figure 1
Figure 1. Frequency and position of nsp12 mutations previously implicated in remdesivir resistance.
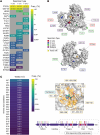
(A) Heatmap of nsp12 mutational frequency at positions previously implicated in remdesivir resistance through in vivo, in vitro, or in silico experimentation (reported as percentage of total SARS-CoV-2 sequences in the GISAID database, n = 15,998,330 sequences [accessed January 4, 2024]). (B) Structure of nsp12 (PDB 7BV2) highlighting the mutations reported in A. Residues within 6 Å of the remdesivir binding pocket are shaded in yellow and labeled in the magnified inset. A linear domain representation of nsp12 highlighting these mutations is shown below. (C) Heatmap of nsp12 mutational frequency (Freq.) at positions that interact with or are within 6 Å of remdesivir (reported as percentage of total SARS-CoV-2 sequences in the GISAID database, n = 15,998,330 sequences [accessed January 4, 2024]).
Figure 2
Figure 2. SARS-CoV-2 divergence in hospitalized patients with COVID-19 treated with and without remdesivir.
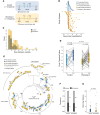
(A) Schematic of the data filtering pipeline used to identify paired specimens for whole-genome sequencing that span hospitalization date in the control cohort (blue) or remdesivir administration date in the remdesivir cohort (orange). (B) Timeline of specimen collection for each patient in each cohort relative to hospitalization. The dotted line indicates the hospitalization date, and the “X” (dark orange) indicates remdesivir administration date. (C) Overlaid histogram and distribution curves of the days between the pre and post samples for each cohort. (D) SARS-CoV-2 N1Ct values for the paired pre and post specimens in each cohort as determined by qRT-PCR. Box-and-whisker plots represent the median (center line) and first/third quartiles (box), with tails extending 1.5 times the IQR. Specimens from the same patient are connected by lines. Statistical analysis for the paired samples within a cohort was conducted using Wilcoxon’s signed-rank test, and statistical analysis for the unpaired samples across cohorts was conducted using the Mann-Whitney U test, with P values indicated. (E) Phylogenetic tree of SARS-CoV-2 whole-genome sequences from each specimen in each cohort. Branch tips are colored by specimen type (pre versus post and cohort) and labeled by use of a randomized patient identifier. Gray patient labels denote identical consensus sequences in pre and post specimens, while black labels denote divergent sequences. Clade designations are specified on the outer ring. (F) Stacked bar chart showing the relative frequency of patients with identical (gray) versus divergent (black) pre and post sequences. The count is shown adjacent to each bar. (G) Hamming distance between paired pre and post specimens in each cohort depicted as a box-and-whisker plot representing the median (center line) and first/third quartiles (box), with tails extending 1.5 times the IQR. Statistical analysis was conducted using a linear model with a negative binomial distribution controlling for time between specimens.
Figure 3
Figure 3. Changes in SARS-CoV-2 genetic diversity after remdesivir administration.
(A) Dot plots depicting mutational frequency per position across the SARS-CoV-2 genome relative to the Wuhan-Hu-1 reference genome, calculated as the fraction of raw reads and colored by nucleotide. All specimens within a group are overlaid in a single plot. Mutational frequencies less than 1% are not shown. (B) Shannon entropy [Sh = SUM[–(pi) * log2(pi)], where pi where is nucleotide frequency] across the genome of each isolate; paired specimens are connected by lines. Statistical analysis was conducted using a linear mixed-effects model controlling for time between paired specimens and within-patient variability. (C) Shannon entropy per nucleotide position within each viral ORF. Statistical analysis was conducted using a linear mixed-effects model while controlling for time between samples, gene, and within-patient variability for each patient. For B and C, box-and-whisker plots represent the median (center line) and first/third quartiles (box), with tails extending 1.5 times the IQR. P values were adjusted for FDR using the Benjamini-Hochberg method; differences at positions with an adjusted P value less than 0.05 were considered significant (values shown in red). M, membrane.
Figure 4
Figure 4. Identification of nucleotide positions with significantly altered genetic diversity after remdesivir administration.
(A) Mutational frequency at positions in nsp12 previously implicated in remdesivir resistance relative to the Wuhan-Hu-1 reference genome in pre and post specimens from each cohort. Nucleotide and amino acid positions are shown below. Box-and-whisker plots represent the median (center line) and first/third quartiles (box), with tails extending 1.5 times the IQR. Only specimens with greater than 1% mutational frequency at a given position are shown (positions that were not detected are indicated as “ND”). (B) Stacked bar plot illustrating the number of patients in each cohort that exhibited a change in Shannon entropy at a given position in paired specimens. To be shown, at least 4 patients in either cohort had to have an increase in Shannon entropy from 0 (i.e., diversification) or decrease to 0 (i.e., purification). (C) Heatmap of mutational frequency at positions identified in B by lineage (reported as percentage of total SARS-CoV-2 sequences per variant in the GISAID database [accessed January 4, 2024]). (D) Shannon entropy in pre and post specimens from each cohort at 3 nucleotide positions that had significant changes following remdesivir administration. Box-and-whisker plots represent the median (center line) and first/third quartiles (box), with tails extending 1.5 times the IQR. Significantly changing positions in the remdesivir cohort were identified using a linear mixed-effects model (specified below the graph) controlling for time between paired specimens, viral load, and within-patient variability for each patient. P values were adjusted for FDR using the Benjamini-Hochberg method; differences at positions with an adjusted P value less than 0.1 were considered significant.
Figure 5
Figure 5. Comparison of nsp12 mutational frequency in patients who received remdesivir compared with a control cohort.
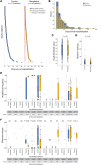
(A) Timeline of specimen collection for each patient in each cohort relative to hospitalization. The dotted line indicates the hospitalization date, and the “X” (dark orange) indicates remdesivir administration date. (B) Overlaid histogram and distribution curves of the days between sample collection and hospitalization date for each cohort. (C) SARS-CoV-2 N1 Ct values for post specimens in each cohort as determined by qRT-PCR. Box-and-whisker plots represent the median (center line) and first/third quartiles (box), with tails extending 1.5 times the IQR. Statistical analysis was conducted using the Mann-Whitney U test, with P values indicated. (D) Shannon entropy across the genome of each isolate. Statistical analysis was conducted using a linear model while controlling for time between samples, viral load, and clade. (E) Mutational frequency at positions in nsp12 previously implicated in remdesivir resistance relative to the Wuhan-Hu-1 reference genome in the post specimen–only cohorts. Two additional positions identified from the analyses in Figure 4 are visualized on the right. Box-and-whisker plots represent the median (center line) and first/third quartiles (box), with tails extending 1.5 times the IQR. Only specimens with greater than 1% mutational frequency at a given position are shown (positions that were not detected are indicated as “ND”). (F) Shannon entropy at the same nucleotide positions as in E in the post specimen–only cohorts. Box-and-whisker plots represent the median (center line) and first/third quartiles (box), with tails extending 1.5 times the IQR. Statistical analysis was conducted using a linear model while controlling for time between samples and viral load (except for position 21771, which had too few data points to fit a model that also included viral load).

References

    1. Wang C, et al. A novel coronavirus outbreak of global health concern. Lancet. 2020;395(10223):470–473. doi: 10.1016/S0140-6736(20)30185-9. - DOI - PMC - PubMed
    1. Zhu N, et al. A novel coronavirus from patients with pneumonia in China, 2019. N Engl J Med. 2020;382(8):727–733. doi: 10.1056/NEJMoa2001017. - DOI - PMC - PubMed
    1. Uyeki TM, et al. First case of Covid-19 in the United States. Reply. N Engl J Med. 2020;382(21):e53. doi: 10.1056/NEJMc2004794. - DOI - PubMed
    1. WHO Coronavirus (COVID-19) Dashboard. https://data.who.int/dashboards/covid19/cases Updated December 29, 2024. Accessed January 15, 2025.
    1. Nordstrom P, et al. Risk of SARS-CoV-2 reinfection and COVID-19 hospitalisation in individuals with natural and hybrid immunity: a retrospective, total population cohort study in Sweden. Lancet Infect Dis. 2022;22(6):781–790. doi: 10.1016/S1473-3099(22)00143-8. - DOI - PMC - PubMed

MeSH terms