. 2025 Jan 21;10(5):e188710.
doi: 10.1172/jci.insight.188710.

Impaired axonal transport contributes to neurodegeneration in a Cre-inducible mouse model of myocilin-associated glaucoma

Affiliations

Impaired axonal transport contributes to neurodegeneration in a Cre-inducible mouse model of myocilin-associated glaucoma

Balasankara Reddy Kaipa et al. JCI Insight. .

Abstract

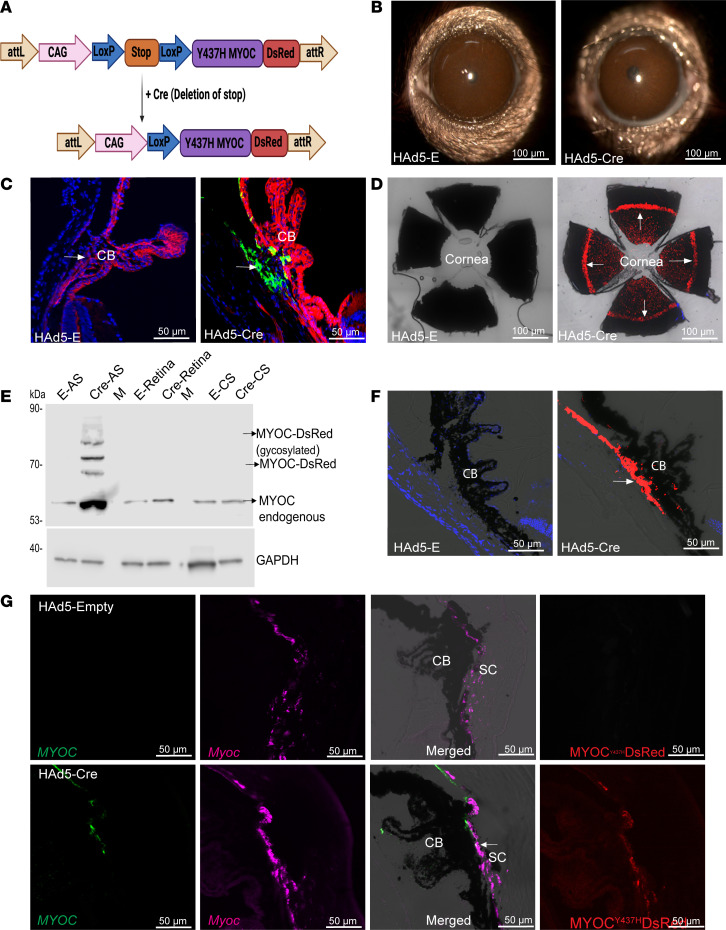
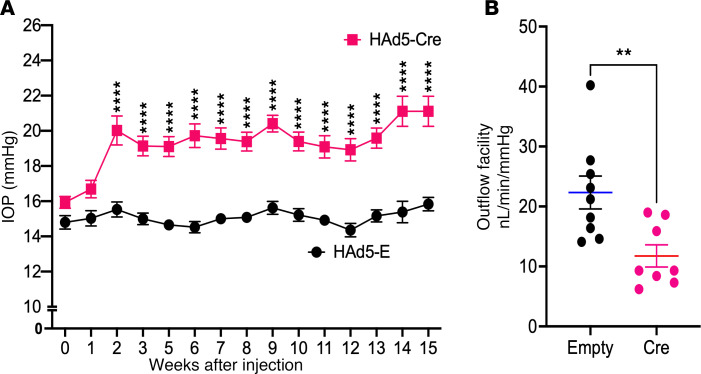
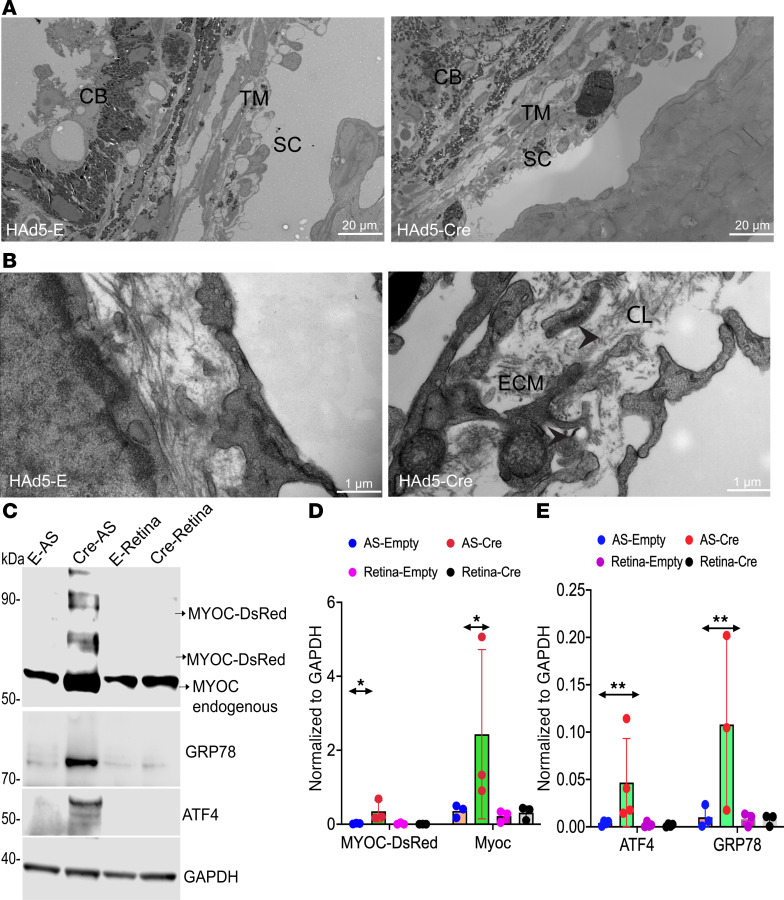
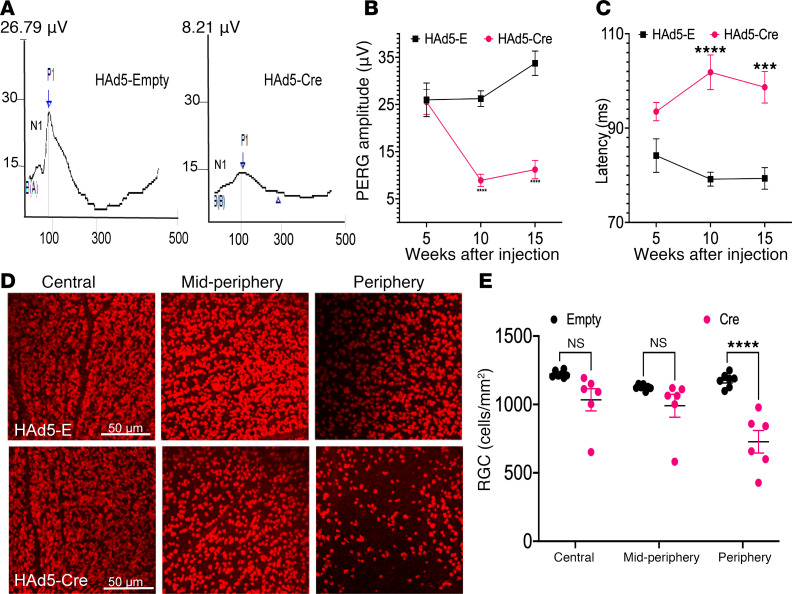
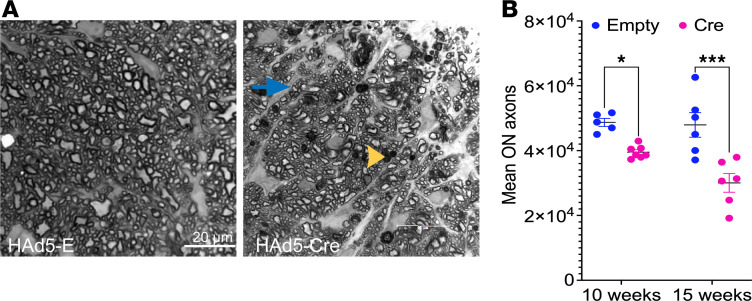
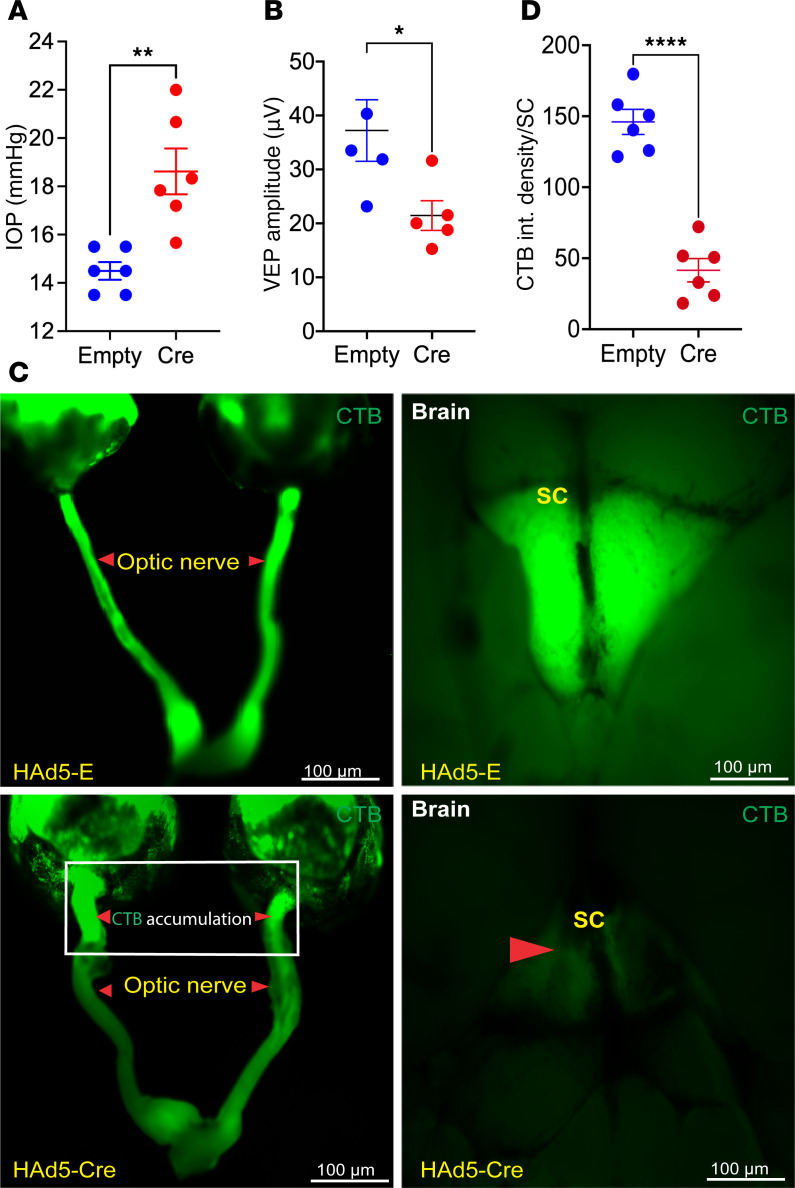
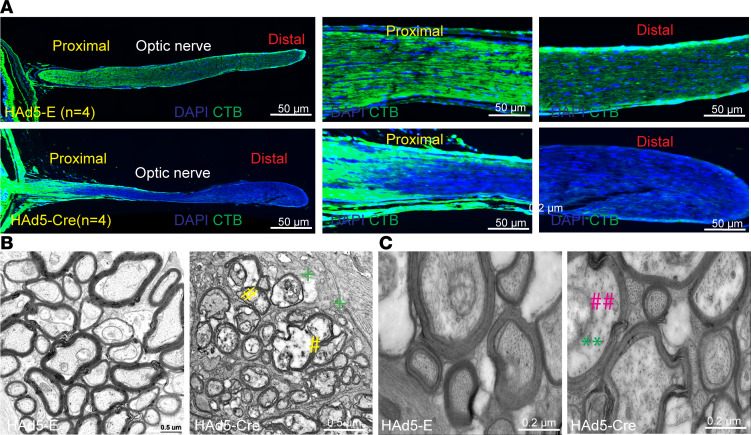
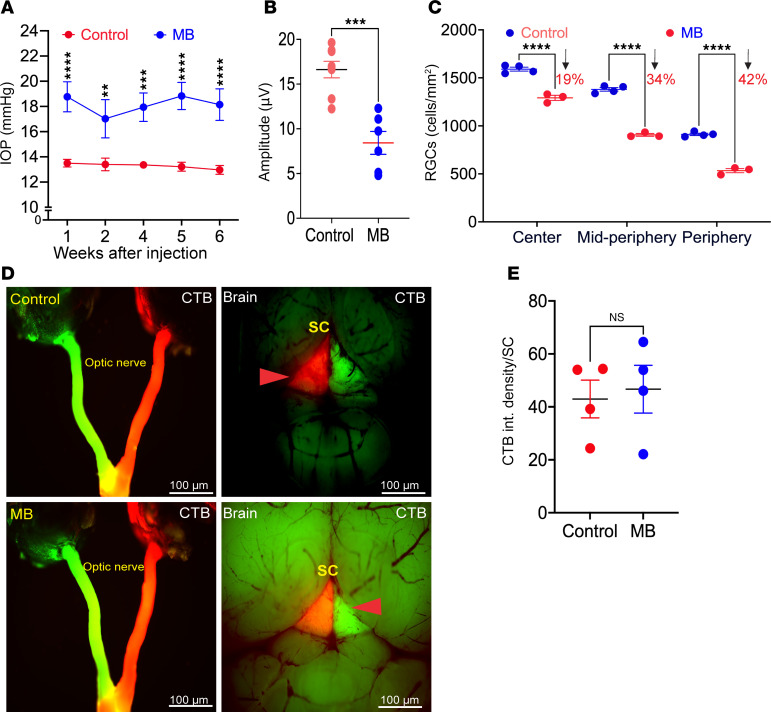
Elevation of intraocular pressure (IOP) due to trabecular meshwork (TM) dysfunction, leading to neurodegeneration, is the pathological hallmark of primary open-angle glaucoma (POAG). Impaired axonal transport is an early and critical feature of glaucomatous neurodegeneration. However, a robust mouse model that accurately replicates these human POAG features has been lacking. We report the development and characterization of a new Cre-inducible mouse model expressing a DsRed-tagged Y437H mutant of human myocilin (Tg.CreMYOCY437H). A single intravitreal injection of HAd5-Cre induced selective MYOC expression in the TM, causing TM dysfunction, reducing the outflow facility, and progressively elevating IOP in Tg.CreMYOCY437H mice. Sustained IOP elevation resulted in significant loss of retinal ganglion cells (RGCs) and progressive axonal degeneration in Cre-induced Tg.CreMYOCY437H mice. Notably, impaired anterograde axonal transport was observed at the optic nerve head before RGC degeneration, independent of age, indicating that impaired axonal transport contributes to RGC degeneration in Tg.CreMYOCY437H mice. In contrast, axonal transport remained intact in ocular hypertensive mice injected with microbeads, despite significant RGC loss. Our findings indicate that Cre-inducible Tg.CreMYOCY437H mice replicate all glaucoma phenotypes, providing an ideal model for studying early events of TM dysfunction and neuronal loss in POAG.

Keywords: Genetics; Neurodegeneration; Neuroscience; Ophthalmology; Protein misfolding; Transport.


Conflict of interest statement

Conflict of interest: The authors have declared that no conflict of interest exists.

Figures

Figure 1
Figure 1. HAd5-Cre recombinase induces mutant MYOC in mouse TM.
(A) Tg.CreMYOCY437H mice were engineered using a TARGATT gene knock-in strategy in which DsRed-tagged human Y437H-mutant MYOC was inserted in a transcriptionally active genomic locus (H11). A stop cassette prevents the expression of the mutant MYOC-DsRed fusion protein until Cre recombinase is introduced. Following Cre expression, the stop cassette is excised, allowing the expression of the mutant MYOC fused with DsRed only in targeted cells. (B) Representative slit-lamp images showing that no obvious ocular inflammation is associated with either HAd5-Empty– or HAd5-Cre–injected Tg.CreMYOCY437H mice (n = 6). Scale bars: 100 μm. (C) HAd5-Cre was injected intravitreally (2 × 10⁷ pfu/eye) in mT/mG fluorescence-based reporter mice, and the conversion from tdTomato to GFP was examined 1 week after injection using confocal microscopy (n = 4). (DF) Tg.CreMYOCY437H mice were injected intravitreally with HAd5-Empty or HAd5-Cre, and MYOC induction was examined in the TM using confocal imaging of DsRed protein in whole mount anterior segment (scale bars: 100 μm) (D), Western blot analysis of various ocular tissues with MYOC-antibody (E) showing the presence of human mutant myocilin in anterior-segment tissues of Cre-injected eyes (8 weeks after injection; AS, anterior segment; M, empty lane; CS, choroid and sclera); and confocal imaging of DsRed protein in the anterior-segment cross-section from Cre- and Cre+-Tg.CreMYOCY437H mice (F) (n = 4). Scale bars: 50 μm.. (G) RNAScope analysis of MYOC (green) and Myoc (pink) transcripts in the anterior-segment cross-section of Cre- and Cre+-Tg.CreMYOCY437H mice. The last panel shows DsRed-protein expression on the same slide. Note that DsRed fluorescence may appear to be less intense compared with other images, due to fluorescence quenching during sample processing (TM, trabecular meshwork; CB, ciliary body; SC, Schlemm’s canal). Arrows show the TM. Scale bars: 50 μm.
Figure 2
Figure 2. Intravitreal administration of HAd5-Cre elevates IOP and decreases outflow facility in Tg.CreMYOCY437H mice.
Three-month-old Tg.CreMYOCY437H mice received a single intravitreal injection of either HAd5-Empty or HAd5-Cre in both eyes. (A) Weekly IOP measurements demonstrated significant and sustained IOP elevation in Cre-injected Tg.CreMYOCY437H mice compared with HAd5-Empty–injected mice (n = 14 in Empty, and n = 18 in Cre-injected group; analyzed by 2-way ANOVA with multiple comparisons, ****P < 0.0001). (B) Outflow facility measurements showed a significant reduction in outflow facility 5 weeks post HAd5-Cre injection of Tg.CreMYOCY437H mice (n = 8) compared with HAd5-Empty–injected mice (n = 9) (unpaired t test, 2-tailed, mean ± SEM, **P < 0.0072).
Figure 3
Figure 3. Mutant-MYOC–induced ocular hypertension is associated with ultrastructural and biochemical changes in the TM.
(A and B) Representative low-magnification (A) and high-magnification (scale bars: 20 μm) (B) TEM images of Tg.CreMYOCY437H mice 8 weeks after injection of HAd5-Empty or HAd5-Cre, showing the presence of loosely bound collagen fibers, ECM deposition, and loss of TM integrity in the juxtacanalicular-connective-tissue (JCT) region of Cre-injected Tg.CreMYOCY437H mice (n = 4 in each group) (TM, trabecular meshwork; CB, ciliary body; SC, Schlemm’s canal; CL, collagen fibers; ECM, extra cellular matrix). Scale bars: 1 μm. (C and D) Western blot and densitometric analyses showing that mutant MYOC induces ER stress in the anterior-segment tissue lysates of Cre-injected Tg.CreMYOCY437H mice (n = 3). (E) HAd5-Empty; AS, anterior segment. Two-way ANOVA with multiple comparisons (**P = 0.0053, *P = 0.0216).
Figure 4
Figure 4. Sustained IOP elevation leads to functional and structural loss of RGCs in Cre-injected Tg.CreMYOCY437H mice.
Three- to 6-month-old Tg.CreMYOCY437H mice were injected intravitreally with HAd5-Empty or HAd5-Cre in both eyes, and IOP was monitored weekly to ensure IOP elevation. PERG was performed at 5, 10, and 15 weeks after treatment to assess the function of the RGCs. (AC) A representative PERG graph (A) and its analysis (B and C) demonstrated significantly reduced PERG amplitude (B) and increased latency (C) starting from 10 weeks post Cre-injection, indicating functional loss of RGCs in Cre+-Tg.CreMYOCY437H mice (n = 6 in HAd5-Empty, and n = 6 in HAd5-Cre), 2-way ANOVA with multiple comparisons (***P = 0.0001, ****P < 0.0001). (D and E) RGC loss was further analyzed by staining the whole-mount retina with RBPMS antibody. A representative image of RBPMS staining of different regions of the retina (D) and its analyses (E) revealed a significant loss (33%) of RGCs in Tg.CreMYOCY437H mice 15 weeks after HAd5-Cre–injection compared with control mice injected with HAd5-Empty (n = 7 for HAd5-Empty, and n = 6 for HAd5-Cre). Two-way ANOVA with multiple comparisons (****P < 0.0001). Scale bars: 50 μm.
Figure 5
Figure 5. Sustained IOP elevation leads to optic nerve degeneration in Cre-injected Tg.CreMYOCY437H mice.
Optic nerves were subjected to PPD staining to assess optic-nerve degeneration. (A) Representative images of PPD-stained optic nerves showing mild axonal degeneration as evident from darkly stained axons (yellow arrowhead) and the presence of glial scar formation (blue arrow) in Cre-injected Tg.CreMYOCY437H mice. Scale bars: 20 μm. (B) the mean axonal counts show a significant loss of ON axons (20% at 10 weeks and 45% at 15 weeks after injection in Cre-induced Tg.CreMYOCY437H mice (*P = 0.0351 for 10 weeks after injection, n = 5 for Empty, and n = 7 for Cre; ***P = 0.0001 for 15 weeks after injection, n = 6 for Empty, and n = 6 for Cre). Two-way ANOVA with multiple comparisons.
Figure 6
Figure 6. Anterograde transport deficits precede RGC degeneration in Tg.CreMYOCY437H mice.
Fifteen-month-old Tg.CreMYOCY437H mice were injected intravitreally with HAd5-Empty or HAd5-Cre, and glaucoma phenotypes and anterograde axonal-transport mechanisms were investigated. (A) IOP measurement revealed significant and sustained IOP elevation at 6 weeks post-injection (n = 6; unpaired t test; P = 0.0058). (B) VEP measurements demonstrated a significant loss of postretinal visual pathway function at 7 weeks after Cre injection in Tg.CreMYOCY437H mice (n = 5; unpaired t test; P = 0.0374). (C and D) Mutant-MYOC–induced ocular hypertension leads to axonal transport deficits in Cre-injected Tg.CreMYOCY437H mice. Representative images of CTB fluorescence (C) and its analysis (D) at 7 weeks after injection of HAd5-Empty or HAd5-Cre in Tg.CreMYOCY437H mice. Empty-injected Tg.CreMYOCY437H mice exhibited an uninterrupted transport of CTB along the entire length of the optic nerve to the SC. However, CTB transport was blocked significantly at the ONH region, and no CTB was detected in the SC at 7 weeks after Cre injection in Tg.CreMYOCY437H mice (n = 6 in each group). Scale bars: 100 μm. Small arrowheads indicate optic nerve, and large arrowhead indicates superior colliculus (SC).
Figure 7
Figure 7. Decreased microtubules and neurofilament are associated with axonal transport deficits in the ONH region.
(A) Whole eyes along with the ON from CTB-injected Tg.CreMYOCY437H mice were sectioned to image CTB transport along the ON. Retinal cross-sections demonstrated blockage of CTB transport in the proximal region of the ON in Cre-injected Tg.CreMYOCY437H mice (n = 3). Scale bars: 50 μm. (B and C) Low-magnification (scale bars: 0.5 μm) (B) and high-magnification (C) TEM analysis of optic nerves from Tg.CreMYOCY437H mice injected with HAd5-Empty or HAd5-Cre, demonstrating cytoskeleton degeneration, organelle accumulation, and the presence of glial scar prior to RGC degeneration at 7 weeks after Cre injection (n = 4). #, organelle accumulation; +, glial scar; **, neurofilament; ##, microtubule. Scale bars: 0.2 μm.
Figure 8
Figure 8. Anterograde axonal transport remains intact despite RGC degeneration in ocular hypertensive mice injected with microbeads.
Four-month-old C57BL/6 mice were injected intracamerally with PBS or microbeads (MB). Glaucoma phenotypes and anterograde axonal transport mechanisms were investigated. (A) IOP measurements revealed significant and sustained IOP elevation in MB-injected mice starting from the first week of injection. Note that only ~50% of eyes injected with MB exhibited the expected IOP elevation; i.e., ≥ 4 mm Hg. The graph only includes eyes that showed sustained IOP elevation of 4 mm Hg or more. (n = 10 for control, n = 7 MB; analyzed by 2-way ANOVA with multiple comparisons; ****P < 0.0001). (B) PERG measurements demonstrated a significant functional loss of RGCs at 6 weeks after MB injection (n = 8 control, n = 6 MB; unpaired t test, 2-tailed, mean ± SEM, ***P = 0.0002). (C) Analysis of RGCs by RBPMS staining of retinal whole mounts revealed a significant loss of RGCs at 6 weeks after MB injection (n = 4 for control, n = 3 MB; analyzed by 2-WAY ANOVA with multiple comparisons, ****P < 0.0001). (D and E) Representative images of CTB fluorescence in the optic nerve and SC, and analysis of CTB fluorescence in ocular hypertensive mice 4 weeks after MB injection. CTB transport remained intact despite significant RGC loss in MB-injected mice (n = 4 in each group; unpaired t test). Scale bars: 100 μm.

Update of

Similar articles

Cited by

References

    1. Quigley HA, Broman AT. The number of people with glaucoma worldwide in 2010 and 2020. Br J Ophthalmol. 2006;90(3):262–267. doi: 10.1136/bjo.2005.081224. - DOI - PMC - PubMed
    1. Quigley HA. Neuronal death in glaucoma. Prog Retin Eye Res. 1999;18(1):39–57. doi: 10.1016/S1350-9462(98)00014-7. - DOI - PubMed
    1. Tham YC, et al. Global prevalence of glaucoma and projections of glaucoma burden through 2040: a systematic review and meta-analysis. Ophthalmology. 2014;121(11):2081–2090. doi: 10.1016/j.ophtha.2014.05.013. - DOI - PubMed
    1. Dias MS, et al. The role of axonal transport in glaucoma. Int J Mol Sci. 2022;23(7):3935. doi: 10.3390/ijms23073935. - DOI - PMC - PubMed
    1. Chidlow G, et al. The optic nerve head is the site of axonal transport disruption, axonal cytoskeleton damage and putative axonal regeneration failure in a rat model of glaucoma. Acta Neuropathol. 2011;121(6):737–751. doi: 10.1007/s00401-011-0807-1. - DOI - PMC - PubMed

MeSH terms