. 2025 Apr;12(13):e2408753.
doi: 10.1002/advs.202408753. Epub 2025 Jan 21.

Deletion of Pyruvate Carboxylase in Tubular Epithelial Cell Promotes Renal Fibrosis by Regulating SQOR/cGAS/STING-Mediated Glycolysis

Affiliations

Deletion of Pyruvate Carboxylase in Tubular Epithelial Cell Promotes Renal Fibrosis by Regulating SQOR/cGAS/STING-Mediated Glycolysis

Hao Huang et al. Adv Sci (Weinh). 2025 Apr.

Abstract

Renal fibrosis is a common pathway involved in the progression of various chronic kidney diseases to end-stage renal disease. Recent studies show that mitochondrial injury of renal tubular epithelial cells (RTECs) is a crucial pathological foundation for renal fibrosis. However, the underlying regulatory mechanisms remain unclear. Pyruvate carboxylase (PC) is a catalytic enzyme located within the mitochondria that is intricately linked with mitochondrial damage and metabolism. In the present study, the downregulation of PC in various fibrotic animal and human kidney samples is demonstrated. Renal proximal tubule-specific Pcx gene knockout mice (PcxcKO) has significant interstitial fibrosis compared to control mice, with heightened expression of extracellular matrix molecules. This is further demonstrated in a stable PC knock-out RTEC line. Mechanistically, PC deficiency reduces its interaction with sulfide:quinone oxidoreductase (SQOR), increasing the ubiquitination and degradation of SQOR. This leads to mitochondrial morphological and functional disruption, increased mtDNA release, activation of the cGAS-STING pathway, and elevated glycolysis levels, and ultimately, promotes renal fibrosis. This study investigates the molecular mechanisms through which PC deficiency induces mitochondrial injury and metabolic reprogramming in RTECs. This study provides a novel theoretical foundation and potential therapeutic targets for the pathogenesis and treatment of renal fibrosis.

Keywords: SQOR; cGAS‐STING; glycolysis; pyruvate carboxylase; renal fibrosis.


Conflict of interest statement

The authors declare no conflict of interest.

Figures
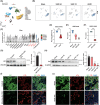
Figure 1
Figure 1
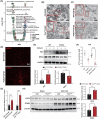
Pyruvate carboxylase (PC) was significantly decreased in various animal renal fibrotic models. A) Composition and distribution of single cells from GSE140023. B) Uniform manifold approximation and projection (UMAP) and C) violin plot of the GSE140023 dataset showing the Pcx expression pattern in mouse kidneys that underwent sham or unilateral ureteral obstruction (UUO) operations. The mRNA levels of D,E) Pcx in mouse sham or UUO kidneys and F) in allopurinol diet rats and wildtype (WT) controls. G) Western blot analysis and densitometric quantification of PC expression in kidney cortical tissues from control diet mice (n = 3) and mice subjected to 21 days of adenine diet (n = 3). H) Western blot analysis and densitometric quantification of PC expression in kidney cortical tissues from WT mice (n = 3) and UUO mice (n = 3). I) Immunofluorescence for PC/LTL in control kidneys and those of mice subjected to 21 days of adenine diet. Scale bar, 100 µm (n = 4). J) Immunofluorescence for PC/lotus tetragonolobus lectin (LTL) in sham kidneys and those of mice subjected to 14 days of UUO. Scale bar: 100 µm (n = 4). Results are expressed as mean ± SEM. *P < 0.05; **P < 0.01; and ***P < 0.001.
Figure 2
Figure 2
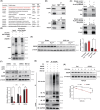
Pyruvate carboxylase (PC) expression correlated with renal function and fibrosis in patients with chronic kidney disease (CKD). A) Correlation analysis of PC and glomerular filtration rate (GFR), serum creatinine, and proteinuria with the data of patients with CKD from the Nephroseq database. B) Representative images for Masson's trichrome and immunohistochemical staining of PC expression in renal biopsy specimens from patients with IgA nephropathy (IgAN, n = 10), diabetic nephropathy (DN, n = 10), hypertensive nephropathy (HN, n = 5), and obstructive nephropathy (ON, n = 3). Statistical graphs for C) Masson's trichrome and D) immunohistochemical staining. E) Correlation analysis of PC and Masson staining area, CKD stage, estimated GFR, and serum creatinine from subjects with IgAN, DN, HN, and ON. Scale bar: 100 µm. Results are expressed as mean ± SEM. *P < 0.05; **P < 0.01; and ***P < 0.001.
Figure 3
Figure 3
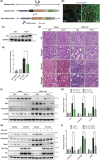
Pcx deficiency induces spontaneous kidney fibrosis. A) Schematic representation illustrating the genetic approach used to generate Pcx conditional knockout mice (Pcx cKO). B) Western blot analysis and C) immunofluorescence detected the pyruvate carboxylase (PC) protein levels in control mouse (Pcx flox/flox) and 2‐month‐old Pcx cKO mouse kidney tissues. D) Representative images and statistical graphs for hematoxylin and eosin (HE), E) Masson's trichrome, and immunohistochemical staining of F) collagen I and G) vimentin expression in renal tissues from control and Pcx cKO mice aged 2‐ or 16‐months‐old (n = 5/ea.). Dashed squares indicate the enlarged regions. H,I) Western blot analysis and densitometric quantification of PC, FN1, COL1A1, vimentin, and p‐Smad3 in kidney tissues from control and Pcx cKO mice at 2 or 16 months (n = 3/ea.). Scale bar, white, 40 µm; black, 100 µm. Results are expressed as mean ± SEM. *P < 0.05; **P < 0.01; and ***P < 0.001.
Figure 4
Figure 4
Conditional knockout of pyruvate carboxylase (PC) in tubular epithelial cells exacerbates unilateral ureteral obstruction (UUO)‐induced renal fibrosis. A) Representative images and statistical graphs for hematoxylin and eosin (HE), B) Masson's trichrome, and immunohistochemical staining of C) collagen I and D) vimentin expression in renal tissues from control and Pcx cKO mice subjected to sham operation or 14 days after the UUO operation (n = 5/ea.). Dashed squares indicate the enlarged regions. E,F) Western blot analysis and densitometric quantification of FN1, COL1A1, vimentin, p‐Smad3, and α‐SMA in kidney tissues from control and Pcx cKO mice subjected to sham operation or 14 days after the UUO operation (n = 3/ea.). Scale bar: 100 µm. Results are expressed as mean ± SEM. **P < 0.01 and ***P < 0.001.
Figure 5
Figure 5
Pyruvate carboxylase (PC) deficiency can exacerbate the fibrosis of HK‐2 cells induced by TGF‐β1. HK‐2 cells underwent stable knock‐out of control or PC (WT or PCKO) genes and were stimulated with TGF‐β1 for 24 h (15 ng mL−1). A,B) Western blot analysis and densitometric quantification of PC and extracellular matrix components (N‐CAD, FN1, and COL1A1) expression (n = 3/ea.). C,D) Western blot analysis and densitometric quantification of Wnt/β‐Catenin/Snail and partial epithelial–mesenchymal transition (EMT) pathways (p‐SMAD3, ZEB‐1, β‐Catenin, SNAIL, vimentin, and α‐SMA) expression (n = 3/ea.). Results are expressed as mean ± SEM. *P < 0.05 and **P < 0.01. WT, wildtype.
Figure 6
Figure 6
Pyruvate carboxylase (PC) knockout increased glycolysis levels. A,B) Targeted metabolomics showed the metabolites of glycolysis in HK‐2 cells of the WT+TGF‐β1 and PCKO+TGF‐β1 groups and mouse kidney of Pcx flox/flox+UUO and Pcx cKO+UUO groups. The color in the heatmaps from blue to red shows the progression from low expression to high expression, respectively. C) Mitochondrial extracellular acidification rate (ECAR) in HK‐2 cells of different groups (n = 6/ea.). D) Basal glycolysis, maximal glycolysis, and glycolytic reserve in HK‐2 cells of different groups (n = 6/ea.). E) Mitochondrial oxygen consumption rate (OCR) in HK‐2 cells of different groups (n = 6/ea.). F) Basal respiration, maximal respiration, and spare respiratory capacity in HK‐2 cells of different groups (n = 6/ea.). G,H) Western blot analysis and densitometric quantification of HK2, PKM2, ATP5A, UQCRC2, MTCO1, SDHB, and NUDFB8 kidney tissues from control and Pcx cKO mice subjected to sham operation or 14 days after the UUO operation (n = 3/ea.). I–L) Enzymatic activity assay results of hexokinase (HK), pyruvate kinase (PK), succinate dehydrogenase (SDH), and mitochondrial complex III in kidney tissues from control and Pcx cKO mice subjected to sham operation or 14 days after the UUO operation (n = 6/ea.). Results are expressed as mean ± SEM. *P < 0.05; **P < 0.01; and ***P < 0.001; ns, non‐significant. WT, wildtype.
Figure 7
Figure 7
Pyruvate carboxylase (PC) knockout‐induced mitochondrial damage and activated cGAS‐STING pathway. A) Volcano plot of the profile of the different gene sets (color coded) after performing GSEA on the RNA‐Seq landscape of the PCKO+TGF‐β1 cells (n = 3) compared to WT+TGF‐β1 cells (n = 3). Adjusted p‐value (p.adj) and normalized enrichment score (NES) result from the GSEA. B) Representative electron micrograph of mitochondria in kidney tissues from control and Pcx cKO mice subjected to sham operation or 14 days after the UUO operation. C) Representative electron micrograph of mitochondria in HK‐2 cells of the WT+TGF‐β1 and PCKO+TGF‐β1 groups. D) Representative images of mitochondrial ROS under fluorescence microscope of HK‐2 cell of WT+TGF‐β1 and PCKO+TGF‐β1 groups. E) Western blot analysis and densitometric quantification of FIS1 and MFN2 in HK‐2 cells of the WT+TGF‐β1 and PCKO+TGF‐β1 groups (n = 3/ea.). F) ATP assay of HK‐2 cells of different groups (n = 7/ea.). G) Real‐time polymerase chain reaction (RT‐PCR) revealed the mRNA levels of mtDNA (MT‐ND6) in the WT+TGF‐β1 and PCKO+TGF‐β1 groups, as well as in the Pcx flox/flox+UUO and Pcx cKO+UUO groups (n = 4/ea.). H) Western blot analysis and densitometric quantification of cGAS and STING kidney tissues from control and Pcx cKO mice subjected to sham operation or 14 days after the UUO operation (n = 3/ea.). Scale bar, 1 µm. Results are expressed as mean ± SEM. *P < 0.05; **P < 0.01; and ***P < 0.001. GSEA, Gene set enrichment analysis; WT, wildtype.
Figure 8
Figure 8
Pyruvate carboxylase (PC) deficiency reduces sulfide:quinone oxidoreductase (SQOR) stability. A) Top ten candidate interacting proteins. B) Co‐immunoprecipitation analysis investigating the interaction of endogenous PC with SQOR in HK‐2 cells. C) Co‐immunoprecipitation analysis investigating the interaction of exogenous His‐PC with FLAG‐SQOR in 293T cells. D) Glutathione S‐transferase (GST)‐tagged SQOR and His‐tagged PC were purified from E. coli. The beads binding the target proteins were incubated with GST or GST‐SQOR fusion proteins, and the pull‐down proteins were detected with anti‐GST antibody with immunoblotting. E) Western blot analysis and densitometric quantification of SQOR kidney tissues from control and Pcx cKO mice subjected to sham operation or 14 days after the UUO operation (n = 3/ea.). F) Western blot analysis and densitometric quantification of PC and SQOR in siNC or siPC infected HK‐2 cells treated with 10 µm CQ or 10 µm MG132 for 6 h (n = 3/ea.). G) Co‐immunoprecipitation assay for the ubiquitination of SQOR in HEK293 cells transfected with pcPC and ubiquitin‐expressing plasmids and treated with MG132. H) Cycloheximide (CHX) chase assay for SQOR in WT and PCKO HK‐2 cells treated with CHX (500 µg mL−1) for the indicated time points (n = 3/ea.). Results are expressed as mean ± SEM. *P < 0.05 and ***P < 0.001.
Figure 9
Figure 9
Pyruvate carboxylase (PC) alleviates metabolic reprogramming and renal fibrosis after unilateral ureteral obstruction (UUO). A) Schematic representation illustrating the genetic approach used to generate Pcx conditional transgenic mice (Pcx Tg). B) Immunofluorescence and C) western blot analysis detected the PC protein levels in control mouse (Pcx flox/flox) and 2‐month‐old Pcx Tg mouse kidney tissues. D) Representative images and statistical graphs for HE and E) Masson's trichrome in renal tissues from control and Pcx Tg mice subject to sham operation or 14 days after UUO operation (n = 5/ea.). F,G) Western blot analysis and densitometric quantification of PC, FN1, vimentin, and α‐SMA in kidney tissues from control and Pcx Tg mice subjected to sham operation or 14 days after the UUO operation (n = 5/ea.). H,I) Western blot analysis and densitometric quantification of vimentin, p‐Smad3, Snail, His‐tag, and PC in HK‐2 cells transfected with vector plasmids or PC‐His expression plasmids with or without TGF‐β1 stimulation (n = 3/ea.). Scale bar, white, 50 µm; black, 100 µm. Results are expressed as mean ± SEM. *P < 0.05.
Figure 10
Figure 10
Scheme depicting the mechanism of how pyruvate carboxylase (PC)‐deficiency exacerbates renal fibrosis. Under fibrotic conditions, the downregulation of PC in renal tubular epithelial cells (RTECs) reduces its interaction with sulfide:quinone oxidoreductase (SQOR), increasing the ubiquitination and degradation of SQOR. This leads to mitochondrial morphological and functional disruption, increased mtDNA release, activation of the cGAS‐STING pathway, elevated glycolysis levels, and ultimately, promotion of renal fibrosis. Consequently, depleted PC levels significantly increase the deposition of collagen and fibronectin, leading to aggravated kidney fibrosis. Figure created in BioRender. Huang, H. (2025) https://BioRender.com/q76×687.

References

    1. Rossing P., Caramori M. L., Chan J., Heerspink H., Hurst C., Khunti K., Liew A., Michos E. D., Navaneethan S. D., Olowu W. A., Sadusky T., Tandon N., Tuttle K. R., Wanner C., Wilkens K. G., Zoungas S., Craig J. C., Tunnicliffe D. J., Tonelli M. A., Cheung M., Earley A., de Boer I. H., Kidney Int. 2022, 102, 990. - PubMed
    1. Yan Z., Wang G., Shi X., Front. Pharmacol. 2021, 12, 785375. - PMC - PubMed
    1. Hsu C. Y., Ordonez J. D., Chertow G. M., Fan D., Mcculloch C. E., Go A. S., Kidney Int. 2008, 74, 101. - PMC - PubMed
    1. Singh P., Rifkin D. E., Blantz R. C., Clin. J. Am. Soc. Nephrol. 2010, 5, 1690. - PubMed
    1. Lv W., Booz G. W., Wang Y., Fan F., Roman R. J., Eur. J. Pharmacol. 2018, 820, 65. - PMC - PubMed

Substances

LinkOut - more resources