. 2025 Mar;12(10):e2411554.
doi: 10.1002/advs.202411554. Epub 2025 Jan 21.

4-Octyl Itaconate Alleviates Myocardial Ischemia-Reperfusion Injury Through Promoting Angiogenesis via ERK Signaling Activation

Affiliations

4-Octyl Itaconate Alleviates Myocardial Ischemia-Reperfusion Injury Through Promoting Angiogenesis via ERK Signaling Activation

Jiqin Yang et al. Adv Sci (Weinh). 2025 Mar.

Abstract

Myocardial ischemia-reperfusion (IR) injury is a critical complication following revascularization therapy for ischemic heart disease. Itaconate, a macrophage-derived metabolite, has been implicated in inflammation and metabolic regulation. This study investigates the protective role of itaconate derivatives against IR injury. Using a mice model of IR injury, the impact of 7-day 4-Octyl itaconate (4-OI) administration on cardiac function is assessed. Exogenous administration of 4-OI significantly reduces myocardial damage, enhances angiogenesis, and alleviates myocardial hypoxia injury during reperfusion. RNA sequencing and molecular docking techniques are used to find the target of itaconate, and changes in cardiac function are observed in Immune-Responsive Gene1 (IRG1) global knockout mice. In cell culture studies, 4-OI promotes endothelial cell proliferation and migration, mediated by Mitogen-Activated Protein Kinases (MAPK) signaling pathway activation, particularly through Extracellular Signal-Regulated Kinase (ERK) signaling. Inhibition of ERK blocks these beneficial effects on endothelial cells. Furthermore, itaconate synthesis inhibition worsens myocardial damage, which is mitigated by 4-OI supplementation. The results indicate that 4-OI promotes angiogenesis by activating MAPK signaling via FMS-like tyrosine kinase 1 (Flt1), highlighting its potential as a therapeutic strategy for myocardial IR injury.

Keywords: 4‐OI; IRG1; angiogenesis; myocardial ischemia‐reperfusion injury.


Conflict of interest statement

The authors declare no conflict of interest.

Figures
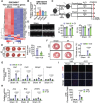
Figure 1
Figure 1
4‐OI alleviates heart dysfunction in WT mice after ischemia‐reperfusion injury. A) Heatmap plot showing the difference of TCA cycle relative gene expression in hearts in GSE245917. B) The relative expression value of Acod1 in GSE160516. C) Workflow of treatment, including IR model, administration of 4‐OI, and analysis. D) Representative echocardiograms of male mice (n = 6) from different groups, and quantification of left ventricular ejection fraction (EF, %), left ventricular fractional shortening (FS, %). E) Infarct area of I/R mice (n = 5) by TTC staining. Scale bar = 100 µm. F) Representative Masson trichrome staining from heart tissues (n = 3). Scale bar = 2 mm. G) The mRNA levels of fibrosis markers Mmp2, Mmp9, Col1, and Col3 in heart tissues (n = 6) were determined by qPCR assay. H) The mRNA levels of heart failure markers Anp, Bnp, and β‐Mhc were detected (n = 6). I) Representative images of DHE (red) staining in heart tissue (n = 6). Scale bar = 20 µm. All data are presented as mean ± SD, and p‐values are calculated using one‐way ANOVA with Bonferroni correction.
Figure 2
Figure 2
The protective effect of 4‐OI on cardiac function is related to angiogenesis. A) GSEA enrichment plot of Response to vascular endothelial growth factor in 4‐OI treatment classified analysis. B) Volcano plot showing the difference of gene expression in hearts between WT mice treated veh and treated 4‐OI subjected to IR operation. C) The top10 GO enrichment analysis of upregulated genes after treating 4‐OI subjected to IR operation. D) The top 10 KEGG pathway analysis of a total of these 416 genes. E) Immunofluorescent staining was performed with antibodies against CD31 (green) and cardiomyocytic marker cTnT (red) (n = 6). Scale bar = 20 µm. F) Immunofluorescent staining was performed with antibodies against SM22 (green) and cardiomyocytic marker cTnT (red) (n = 6). Scale bar = 20 µm. All data are presented as mean ± SD, and the P‐values are calculated using one‐way ANOVA with Bonferroni correction.
Figure 3
Figure 3
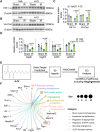
4‐OI can significantly promote angiogenesis in ischemic hearts. A–C) The protein levels of HIF‐1‐α and VE‐Cad in heart tissues (n = 3) after 4‐OI administration. D) The mRNA levels of Vegfα, Vegfr2, Cdh5, and eNOS in heart tissues (n = 6) from WT with Veh or 4‐OI administration. E) The brief flow chart for 4‐OI target prediction. F) The representative GO analysis of the predicted target. All data are presented as mean ± SD, and p‐values are calculated using one‐way ANOVA with Bonferroni correction.
Figure 4
Figure 4
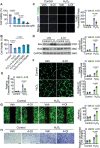
4‐OI mitigates cell injury in HUVECs under hypoxic conditions. A) The viability of HUVEC cells (n = 6) after treatment with various concentrations of H2O2 (0, 100, 200, 300, 400 µm) for 12 h, as detected by the CCK8 assay (n = 6). B) The viability of cells after H2O2 stimulation (200 µm) for 6 h, followed by treatment with different doses (0, 50, 75, 100 µm) of 4‐OI for 12 h, as analyzed by the CCK8 assay (n = 6). C,D, The HUVEC cells were treated with 200 µm H2O2 or a combination of 75 µm and 200 µm H2O2. C) Representative images of TUNEL (green) staining in HUVEC cells (n = 6). Scale bar = 20 µm. D) The expression of Bax and Bcl2 at protein levels was detected in HUVEC cells (n = 4). E) The relative Caspase 3 activities in hearts from different groups were detected (n = 4). F–H) The HUVEC cells were treated with 50 µm H2O2 or a combination of 75 µm and 50 µm H2O2. F) The number of tubes and junction points in tube formation (n = 6). Scale bar = 100 µm. G) The migration distance of HUVECs treated with 4‐OI was measured by the wound healing assay (n = 6). Scale bar = 200 µm. H) 4‐OI‐induced endothelial migration using the transwell migration assay (n = 6). Scale bar = 100 µm. All data are presented as mean ± SD, and p‐values are calculated using one‐way ANOVA with Bonferroni correction.
Figure 5
Figure 5
4‐OI activates MAPK/ERK signaling pathway by targeting Flt1. A–E) The HUVEC cells were treated with 200 µm H2O2 or a combination of 75 µm 4‐OI and 200 µm H2O2. A) Immunoblot analysis of Flt1 oligomerization in HUVECs. B) The expression of ERK and p‐ERK or AKT and p‐AKT at protein levels were detected in HUVEC cells (n = 4). C) The expression of Flt1 or JNK and p‐JNK at protein levels was detected in HUVEC cells (n = 4). D) The expression of P38 and p‐P38 at protein levels were detected in HUVEC cells (n = 4). E) Under hypoxia condition, the mRNA level of Flt1 was detected in HUVEC cells treated with or without 4‐OI. F) The protein level of Flt1 was detected in HUVEC cells treated with siScr or siFlt1 (n = 3). G,H) Under hypoxia condition, the HUVEC cells were treated with siScr or siFlt1. G) The representative image of Western blot assay. H) The expression of p‐ERK/ERK or p‐AKT/AKT at protein levels was detected in HUVEC cells (n = 4). All data are presented as mean ± SD, and p‐values are calculated using one‐way ANOVA with Bonferroni correction.
Figure 6
Figure 6
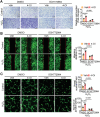
Inhibition of ERK1/2 reverses the protective effect of 4‐OI on HUVECs. A) Transwell migration assay showed that SCH772984 inhibited endothelial cell migration induced by 4‐OI (n = 6). Scale bar = 200 µm. B) Wound healing assay for detecting the migratory ability of DMSO and SCH772984 treated with 4‐OI under hypoxic condition (n = 6). Scale bar = 100 µm. C) The SCH772984 fails to promote tube formation in HUVECs under hypoxic condition (n = 6). Scale bar = 100 µm. All data are presented as mean ± and SD, and p‐values are calculated using one‐way ANOVA with Bonferroni correction.
Figure 7
Figure 7
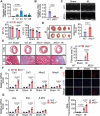
IRG1 deficiency aggravated heart dysfunction after IR injury. A) The mRNA levels of IRG1 in cardiac tissues (n = 6) from mice were monitored by qRT‐PCR assay. B) The mRNA levels of IRG1 in cardiac tissues (n = 6) of C57BL/6 (WT) or IRG1 ‐/‐ mice. C) Representative echocardiograms of mice (n = 6) from different groups, and quantification of left ventricular ejection fraction (EF, %), left ventricular fractional shortening (FS, %). D) Infarct area of IR mice (n = 5) by TTC staining. Scale bar = 100 µm. E) Representative Masson trichrome staining from heart tissues (n = 3). The scale bar of 1.25x = 2 mm. The scale bar of 20x = 100 µm. F) The mRNA levels of fibrosis markers Mmp2, Mmp9, Col1, and Col3 in heart tissues (n = 6) were determined by qPCR assay. G) The mRNA levels of heart failure markers Anp, Bnp, and β‐Mhc were detected (n = 6). H) Representative images of DHE (red) staining in heart tissue (n = 6). Scale bar = 20 µm. All data are presented as mean ± and SD, p‐values are calculated using one‐way ANOVA with Bonferroni correction.
Figure 8
Figure 8
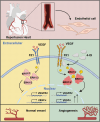
The schematic diagram of the main molecular pathways.

References

    1. Zweier J. L., J. Biol. Chem. 1988, 263, 1353. - PubMed
    1. Hausenloy D. J., Yellon D. M., J. Mol. Cell. Cardiol. 2003, 35, 339. - PubMed
    1. Piper H. M., Garcia‐Dorado D., Ovize M., Cardiovasc. Res. 1998, 38, 291. - PubMed
    1. Lemasters J. J., Bond J. M., Chacon E., Harper I. S., Kaplan S. H., Ohata H., Trollinger D. R., Herman B., Cascio W. E., EXS 1996, 76, 99. - PubMed
    1. Deveza L., Choi J., Yang F., Theranostics 2012, 2, 801. - PMC - PubMed

LinkOut - more resources