. 2025 Jan 21;21(1):e1011566.
doi: 10.1371/journal.pgen.1011566. eCollection 2025 Jan.

Characterizing the regulatory effects of H2A.Z and SWR1-C on gene expression during hydroxyurea exposure in Saccharomyces cerevisiae

Affiliations

Characterizing the regulatory effects of H2A.Z and SWR1-C on gene expression during hydroxyurea exposure in Saccharomyces cerevisiae

Hilary T Brewis et al. PLoS Genet. .

Abstract

Chromatin structure and DNA accessibility are partly modulated by the incorporation of histone variants. H2A.Z, encoded by the non-essential HTZ1 gene in S. cerevisiae, is an evolutionarily conserved H2A histone variant that is predominantly incorporated at transcription start sites by the SWR1-complex (SWR1-C). While H2A.Z has often been implicated in transcription regulation, htz1Δ mutants exhibit minimal changes in gene expression compared to wild-type. However, given that growth defects of htz1Δ mutants are alleviated by simultaneous deletion of SWR1-C subunits, previous work examining the role of H2A.Z in gene expression regulation may be confounded by deleterious activity caused by SWR1-C when missing its H2A.Z substrate (apo-SWR1-C). Furthermore, as H2A.Z mutants only display significant growth defects in genotoxic stress conditions, a more substantive role for H2A.Z in gene expression may only be uncovered after exposure to cellular stress. To explore this possibility, we generated mRNA transcript profiles for wild-type, htz1Δ, swr1Δ, and htz1Δswr1Δ mutants before and after exposure to hydroxyurea (HU), which induces DNA replication stress. Our data showed that H2A.Z played a more prominent role in gene activation than repression during HU exposure, and its incorporation was important for proper upregulation of several HU-induced genes. We also observed that apo-SWR1-C contributed to gene expression defects in the htz1Δ mutant, particularly for genes involved in phosphate homeostasis regulation. Furthermore, mapping H2A.Z incorporation before and after treatment with HU revealed that decreases in H2A.Z enrichment at transcription start sites was correlated with, but generally not required for, the upregulation of genes during HU exposure. Together this study characterized the regulatory effects of H2A.Z incorporation during the transcriptional response to HU.


Conflict of interest statement

The authors have declared that no competing interests exist.

Figures

Fig 1
Fig 1. The htz1Δ, swr1Δ, and htz1Δswr1Δ mutants mRNA expression profiles clustered separately from wild-type.
(A) Experimental overview of the HU-treatment and RNA-sequencing pipeline. Six biological replicates of wild-type, htz1Δ, swr1Δ, and htz1Δswr1Δ cells were grown to log phase and then split into untreated (UT) and HU-treated (HU) conditions. After extracting total RNA from each sample, mRNA transcripts were enriched and then sequenced using a NextSeq500 illumina platform. Graphic created with BioRender.com. (B) Biplot of PC1 and PC2 generated from a Principal Component Analysis (PCA) of normalized read counts. Each data point represents a single biological replicate (n = 6). (C) Spearman’s correlation coefficients matrix of mRNA expression profiles showed that the htz1Δ, swr1Δ, and htz1Δswr1Δ mutants clustered separately from wild-type in both the untreated and HU-treated conditions. Each coloured cell represents the correlation coefficient between the indicated genotypes for a single biological replicate.
Fig 2
Fig 2. Hydroxyurea exposure activated the Environmental Stress Response and the iron regulon.
(A) Volcano plot of DESeq2 results comparing wild-type mRNA expression in untreated and HU-treated conditions. Coloured points are genes with an BH-FDR adjusted p-value < 0.05 and a log2FC ≥ 1 (red) or ≤ −1 (blue). (B) Paired dot plot of the downregulated (blue) and upregulated (red) genes found in wild-type after HU exposure. The top 10 genes with the largest log2FC in each category are listed. (C) HU-dependent DEGs overlapped with genes in the ESR [52]. (D) Gene Ontology term enrichment analyses of the upregulated DEG genes in HU (ESR genes removed from both submitted and background gene lists). BP = Biological Process, MF = Molecular function. (E) There was no significant difference in the percentage of S. pombe reads between the untreated and HU-treated mRNA libraries.
Fig 3
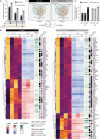
Fig 3. Hydroxyurea exposure increased the proportion of downregulated genes in mutants lacking H2A.Z incorporation.
(A) UpSet plot summarizing the number of DEGs identified in each mutant compared to wild-type in the untreated and HU-treated conditions. (B) Heatmaps illustrating the Z-score and log2FC of normalized read counts for all the unique DEGs identified between the mutants and wild-type in the untreated condition (86 genes, left) and HU-treated condition (105 genes, right). The average expression level of each gene in wild-type under untreated conditions is presented, along with information on whether the gene was condition specific and the number of mutants in which the gene was identified as differentially expressed. (C) Venn diagram summarizing the number of shared and unique DEGs identified in each mutant compared to wild-type. In the untreated condition, a total of 86 unique genes were found among all three mutants, while 105 unique genes were identified in the HU-treated condition. Among these, 52 were exclusive to the untreated condition, and 71 were specific to the HU-treated condition. (D) Percentage of the DEGs identified for each mutant and condition that were downregulated compared to wild-type.
Fig 4
Fig 4. PHO operon genes were repressed in the htz1Δ mutant compared to wild-type and the swr1Δ and htz1Δswr1Δ mutants in both the untreated and HU-treated conditions.
(A) Boxplots showing the expression levels of all 5 genes identified as differentially expressed between the htz1Δ mutant and htz1Δswr1Δ mutant in the HU-treated condition. (B) Heatmaps illustrating the Z-score of normalized read counts for 29 genes in the PHO operon between the mutants and wild-type in the HU-treated condition. The illustrated expression level of each gene is the average in wild-type under HU-treated conditions.
Fig 5
Fig 5. Compared to wild-type, several of the most highly upregulated genes during HU-exposure had smaller fold changes in expression between the untreated and HU-treated conditions in the htz1Δ, swr1Δ, and htz1Δswr1Δ mutants.
(A) Violin plots of the log2FC between the untreated and HU-treated conditions for all four genotypes. All genes are reported on the left, while the top 50 upregulated genes (red) and top 50 downregulated genes (blue) are visualized on the right. Top genes were determined by their degree of log2FC between untreated and HU-treated conditions in wild-type. A one-way ANOVA (α < 0.05) followed by Tukey Kramer post-hoc analysis was used to determine statistically significant comparisons. (B) In the top 50 most upregulated genes in HU, the mutants deviated from wild-type expression in 3 different patterns: 1) similar expression in the untreated condition, but lower expression than wild-type in the HU-treated condition, 2) similar expression in the untreated condition, but higher expression than wild-type in HU-treated condition and 3) higher expression than wild-type in the untreated condition, but similar expression in the HU-treated condition.
Fig 6
Fig 6. Global H2A.Z enrichment patterns were similar between untreated and HU-treated conditions.
(A) MNase-NChIP-seq experimental setup. Graphic created with BioRender.com. (B) Enrichment profiles of H2A.Z and (C) nucleosomes at the TSS of all 5560 genes in untreated and HU-treated cells. Genes in heatmap are sorted by wild-type gene expression level in the untreated condition. (D) Percent of called H2A.Z enrichment peaks that overlapped within 150 bps of a gene feature. A total of 3548 peaks were called in the untreated condition, while 3157 were called in the HU-treated condition. (E) Percent of gene features that are enriched for H2A.Z from the total of 5560 genes used in this study. H2A.Z was considered enriched if a peak called by MACS2 overlapped with the feature coordinates or was within 150 bp of the feature. (F) Percentage of transcription factor (TF) genes and genes part of the iron regulon [53], PHO operon [80], and ESR [52] that were enriched for H2A.Z at their TSS.
Fig 7
Fig 7. Loss of H2A.Z from transcription start sites was correlated with, but not required for, HU-induced gene activation.
(A) Spearman’s correlation coefficient (r) between log2FC in H2A.Z enrichment at TSS’s (BH-FDR adjusted p-values < 0.05) and log2FC of mRNA expression levels of the associated gene. The slope of the correlation is indicated by a dashed black line. (B) 577 genes had changes in H2A.Z enrichment at their TSS in wild-type cells after HU treatment with log2FC either ≥ 1 or ≤ −1 (BH-FDR adjusted p-value < 0.05). Genes are ordered by their mRNA level log2FC between the untreated and HU-treated conditions in wild-type cells. (C) Overlap between the 1064 DEGs and the 577 genes that exhibited differential H2A.Z enrichment at their TSS during HU-exposure in wild-type cells. There was overlap found in all four groups: 1) genes that had increased mRNA expression and H2A.Z enrichment at their TSS in the HU-treated condition, 2) mRNA expression increased, while H2A.Z enrichment decreased, 3) mRNA expression decreased, while H2A.Z enrichment increased, and 4) genes where mRNA expression and H2A.Z enrichment at the TSS decreased after HU exposure. The p-values, generated using hypergeometric probability, indicate if the overlap in each group was significantly greater (red) or less (blue) than excepted by chance (black = non-significant). The bar plots show the percentage of the overlapping genes in each category that were differentially expressed between the HU-treated htz1Δswr1Δ mutant and the UT-treated htz1Δswr1Δ mutant (gold), and that were not differentially expressed between the HU-treated htz1Δswr1Δ mutant and the HU-treated wild-type (teal). (D) H2A.Z and nucleosome enrichment tracks for TIS11, RKM5, NTE1, and HUG1 along with their corresponding transcript tracks untreated and HU-treated conditions. Black box represents the coordinates and log2FC of an H2A.Z peak identified as differentially enriched by DiffBind. The pink boxes indicate the position of the +1 nucleosome at the TSS of each gene.

Similar articles

References

    1. Zlatanova J, Thakar A. H2A.Z: view from the top. Structure. 2008;16(2):166–79. doi: 10.1016/j.str.2007.12.008 - DOI - PubMed
    1. Martire S, Banaszynski LA. The roles of histone variants in fine-tuning chromatin organization and function. Nat Rev Mol Cell Biol. 2020;21(9):522–41. doi: 10.1038/s41580-020-0262-8 - DOI - PMC - PubMed
    1. Giaimo BD, Ferrante F, Herchenröther A. The histone variant H2A.Z in gene regulation. Epigenetics Chromatin. 2019;12(1):1–22. - PMC - PubMed
    1. Zovkic IB, Paulukaitis BS, Day JJ, Etikala DM, Sweatt JD. Histone H2A.Z subunit exchange controls consolidation of recent and remote memory. Nature. 2014;515(7528):582–6. doi: 10.1038/nature13707 - DOI - PMC - PubMed
    1. Maze I, Wenderski W, Noh K-M, Bagot RC, Tzavaras N, Purushothaman I, et al.. Critical role of histone turnover in neuronal transcription and plasticity. Neuron. 2015;87(1):77–94. doi: 10.1016/j.neuron.2015.06.014 - DOI - PMC - PubMed

MeSH terms

LinkOut - more resources