. 2025 Jan 21;23(1):e3002962.
doi: 10.1371/journal.pbio.3002962. eCollection 2025 Jan.

Persistently increased post-stress activity of paraventricular thalamic neurons is essential for the emergence of stress-induced alterations in behaviour

Affiliations

Persistently increased post-stress activity of paraventricular thalamic neurons is essential for the emergence of stress-induced alterations in behaviour

Anna Jász et al. PLoS Biol. .

Abstract

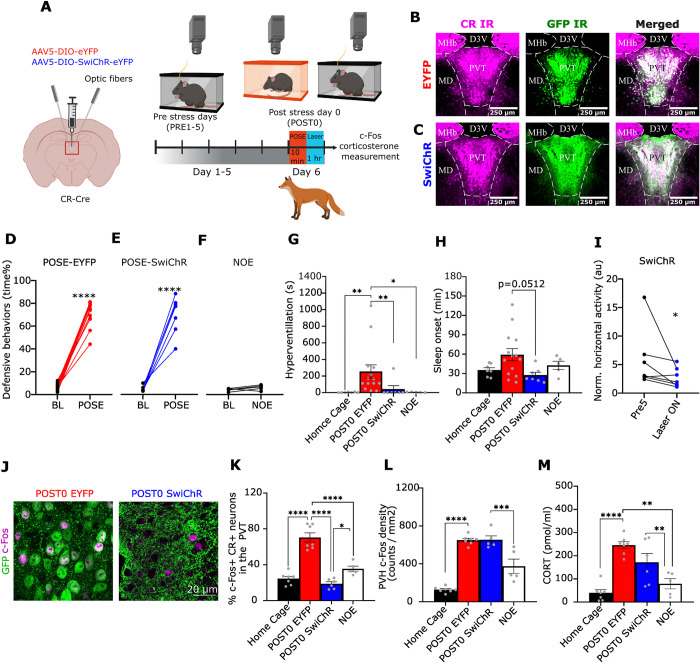
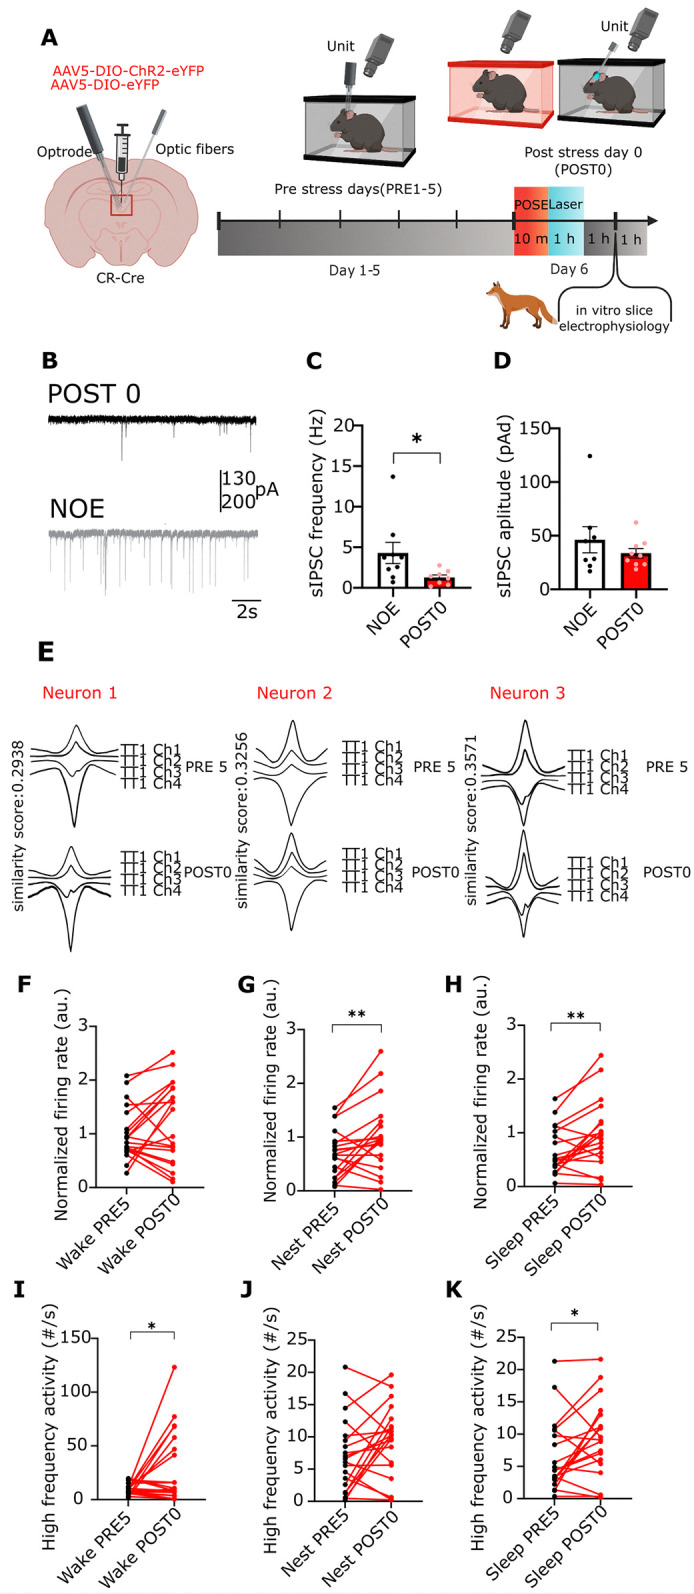
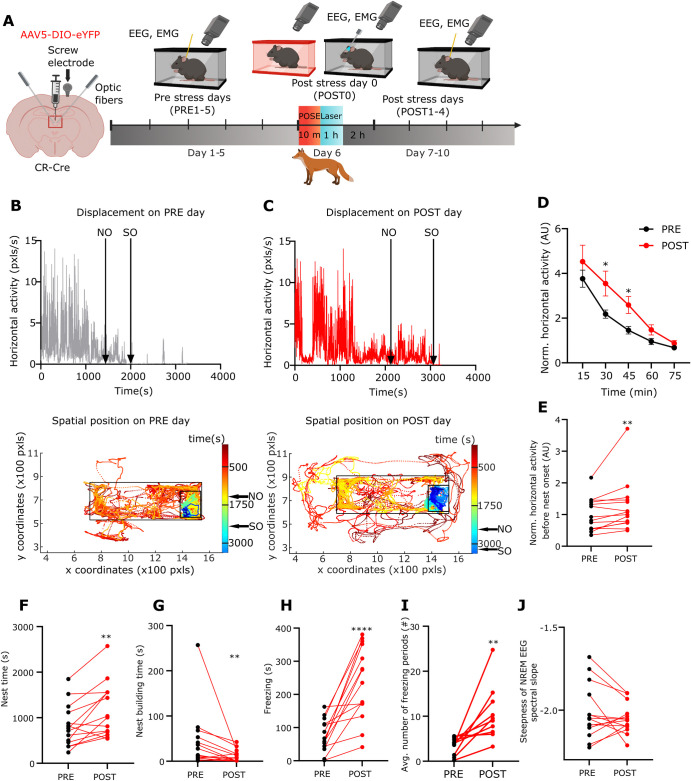
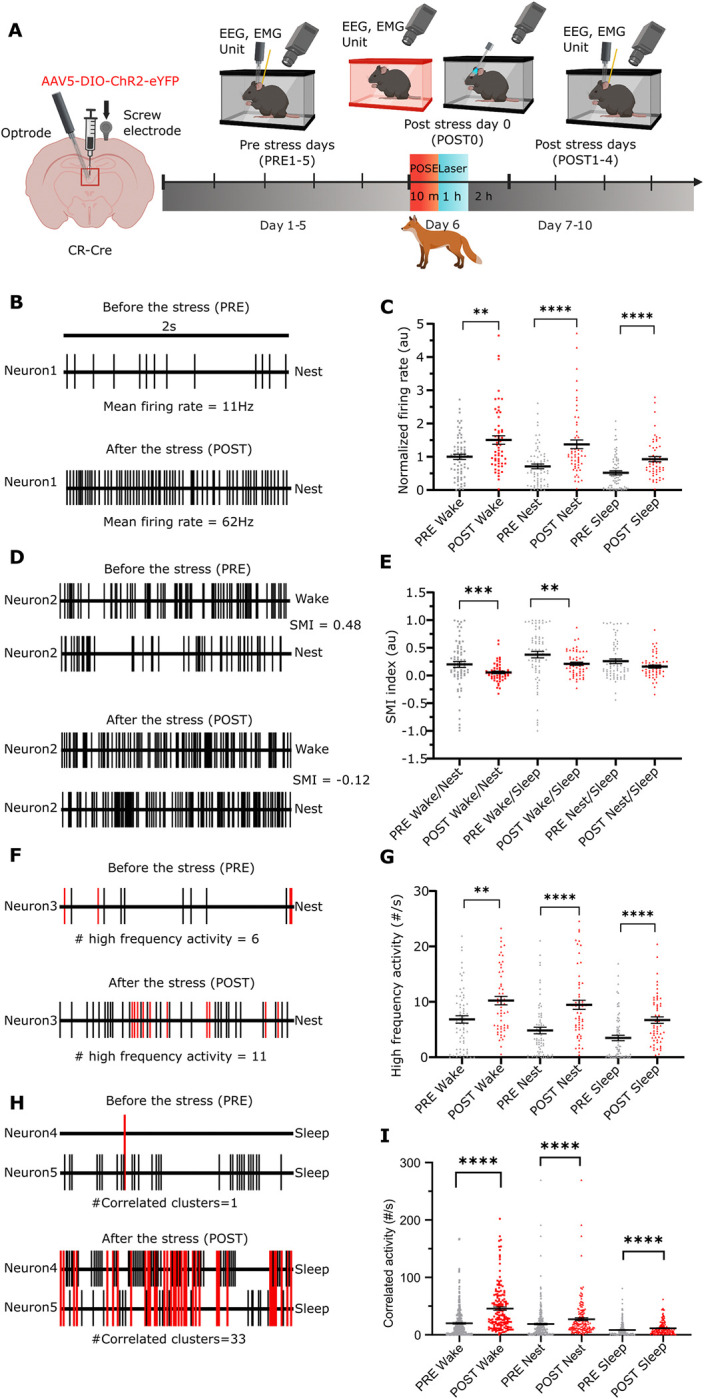
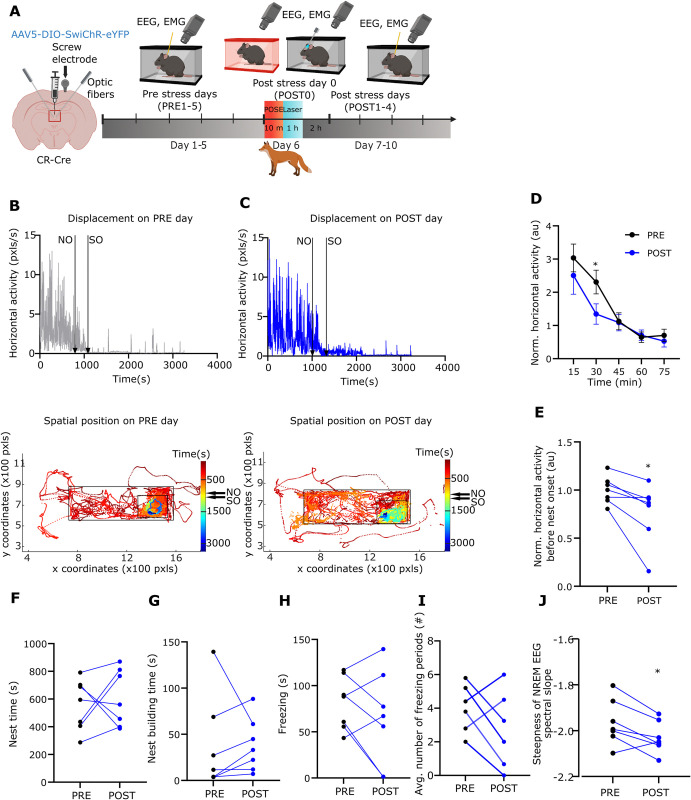
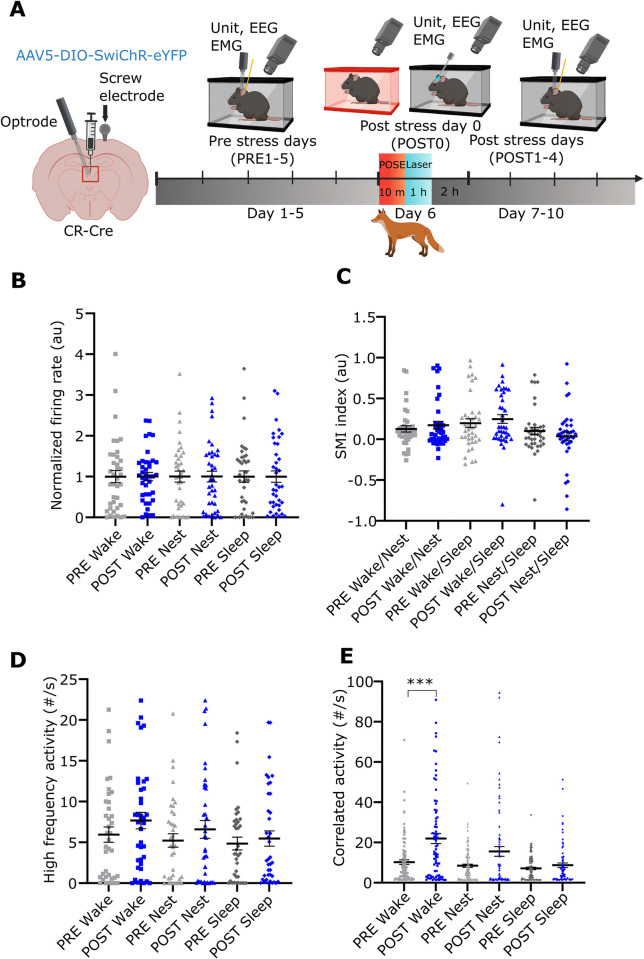
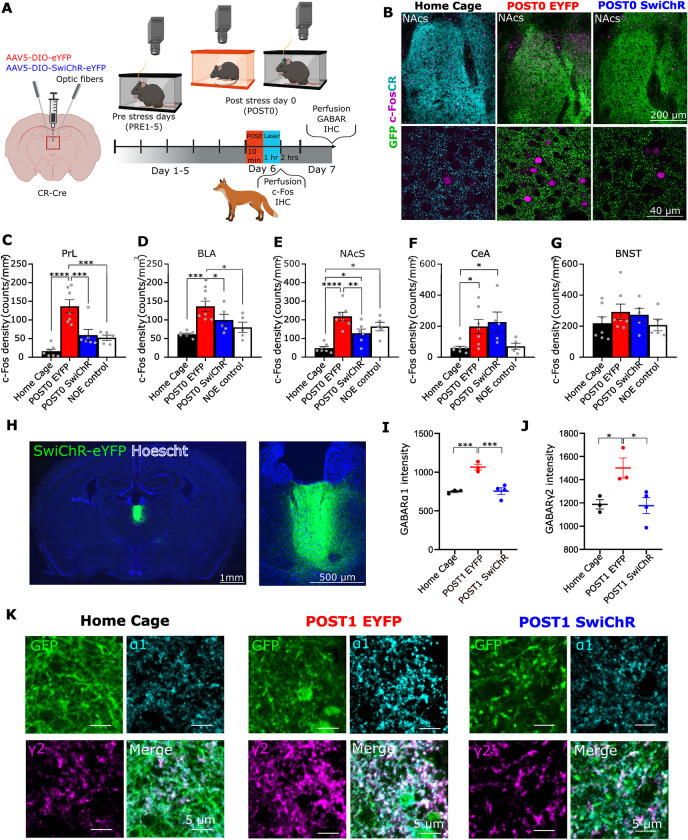
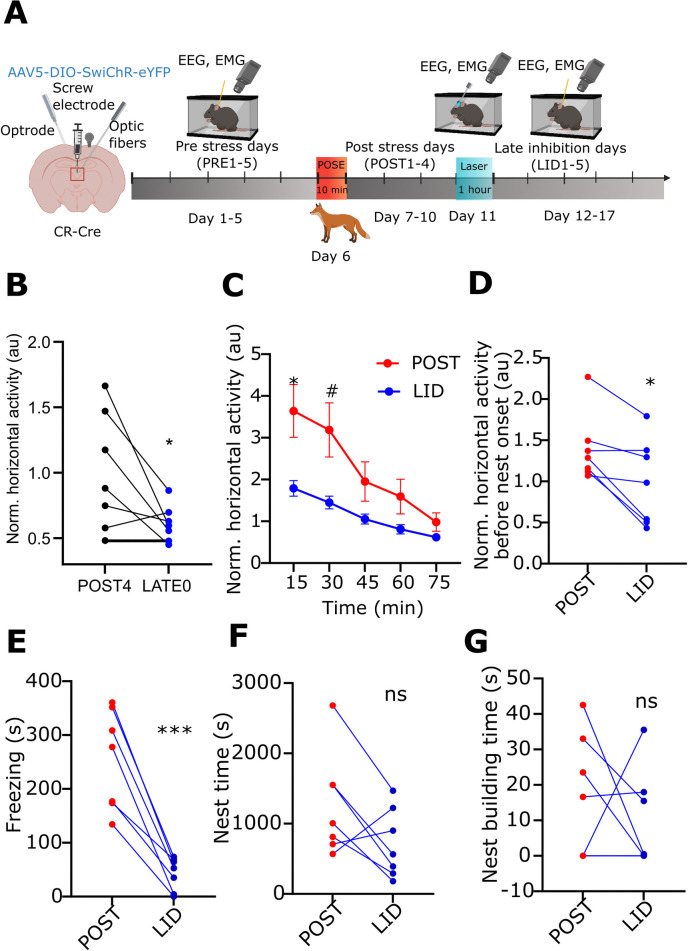
A single exposure to a stressful event can result in enduring changes in behaviour. Long-term modifications in neuronal networks induced by stress are well explored but the initial steps leading to these alterations remain incompletely understood. In this study, we found that acute stress exposure triggers an immediate increase in the firing activity of calretinin-positive neurons in the paraventricular thalamic nucleus (PVT/CR+) that persists for several days in mice. This increase in activity had a causal role in stress-induced changes in spontaneous behaviour. Attenuating PVT/CR+ neuronal activity for only 1 h after the stress event rescued both the protracted increase in PVT/CR+ firing rate and the stress-induced behavioural alterations. Activation of the key forebrain targets (basolateral amygdala, prelimbic cortex, and nucleus accumbens) that mediate defensive behaviour has also been reduced by this post-stress inhibition. Reduction of PVT/CR+ cell activity 5 days later remained still effective in ameliorating stress-induced changes in spontaneous behaviour. The results demonstrate a critical role of the prolonged, post-stress changes in firing activity of PVT/CR+ neurons in shaping the behavioural changes associated with stress. Our data proposes a therapeutic window for intervention in acute stress-related disorders, offering potential avenues for targeted treatment strategies.


Conflict of interest statement

The authors have declared that no competing interests exist.

Figures

Fig 1
Fig 1. Short term effects of inhibiting PVT/CR+ neurons after the predatory odour stress exposure.
(A) Scheme of the experiment. AAVs were injected into PVT and behaviour was assessed 4 weeks later. Following a 5 day baseline period to assess home cage behaviours (PRE5), mice were submitted to POSE. Immediately after the POSE both SwiChR and EYPF groups received a 1 h long, photoinhibition of PVT/CR+ neurons in the home cage. Created with BioRender.com. (B, C) Representative confocal images showing EYFP and SwiChR expression in CR-positive (CR+) PVT neurons. Magenta represents CR immunostaining, while green represents GFP immunostaining, respectively. MD, mediodorsal thalamic nucleus; Hab, habenula; D3V, third ventricle. Scale bars, 250 μm. (D, E) Quantification of time spent with defensive behaviour during predator odour (2MT) stress exposure (POSE) in EYFP (D, t[13] = 21.05) and SwiChR (E, t[6] = 9.35) mice compared to a 2 min baseline (BL) period. (F) Same for the NOE (without 2MT presentation) group (t[4] = 1.822). (G) Bar graph showing the duration of hyperventilation in the Home Cage control group (n = 7), EYFP (n = 7), SwiChR (n = 6), and NOE control (n = 5) in their home cage after POSE (K-W = 21.58, p < 0.0001). The Home Cage control group was not exposed to the novel environment. (H) Bar graph showing the duration of sleep onset in the Home Cage control group (n = 7), EYFP (n = 7), SwiChR (n = 6), and NOE (n = 5) in their home cage after POSE (F(3,29) = 2.961, p < 0.0486). (I) Averaged, normalised horizontal activity during PVT/CR+ photoinhibition in the SwiChR animals (first hour of POST0 day) compared to the same period of the PRE 5 day (W = −26). (J) Confocal images showing c-Fos expression in PVT/CR+ neurons in EYFP and SwiChR mice 1 h after POSE. Note that EYFP is a cytosolic labelling, whereas SwiChR is expressed in membranes. (K, L) Quantification of c-Fos expression in the PVT/CR+ cells (K, F(3,21) = 44.75, p < 0.0001) and in the paraventricular nucleus of the hypothalamus (PVH) (L) 1 h after POSE in the 4 experimental groups; Home Cage control (n = 7); EYFP (n = 7); SwiChR (n = 6); NOE control (F(3,20) = 50.00, p < 0.0001). (M) CORT level in the blood of the 4 experimental groups 1 h after POSE (F(3,21) = 16.96, p < 0.0001). Underlying data can be found in S1 Data. See S10 Data for the full results of the statistical tests. Data are shown as mean ± SEM. *p < 0.05, **p < 0.01, ***p < 0.01, ****p < 0.001. CORT, corticosterone; NOE, no odour exposure; POSE, predatory odour stress exposure; PVH, paraventricular hypothalamic nucleus; PVT, paraventricular thalamic nucleus.
Fig 2
Fig 2. Short-term changes in PVT/CR+ unit activity after predator odour stress exposure.
(A) Scheme of the experiments representing the in vitro and in vivo recordings. Created with BioRender.com. (B) Example traces of sIPSC recordings from NOE and POSE mice. (C) Bar graphs of average sIPSC frequency (U = 11) and (D) amplitude (U = 30) in PVT/CR+ neurons recorded ex vivo from NOE (n = 8 neurons from n = 2 mice) and POSE mice 2 h after POSE (n = 9 neurons from n = 2 mice). (E) Waveforms of 3 optotagged PVT/CR+ neurons recorded by the same tetrode (TT1). The neurons were recorded for 2 consecutive days (top vs. bottom row). Channel numbers (Ch) and similarity scores (see Methods) between the 2 days are shown. (F–H) Alteration in the firing rate of PVT/CR+ neurons recorded for 1 h both on the PRE5 (black dots) and the POST 0 days after the POSE (red dots) in the (F) wake, (G) nest, and (H) sleep states (F, t[19] = 1.499; G, t[19] = 2.871; H, t[19] = 3.378; n = 20 units from n = 4 mice). The firing rate is normalised to the mean wake population average of the PRE 5 day. (I–K) Same as E–G, for HFA (I, t[19] = 2.463; J, t[19] = 1.847; K, t[19] = 2.411). Underlying data can be found in S2 Data. See S10 Data for the full results of the statistical tests. Data are shown as mean ± SEM. *p < 0.05, **p < 0.01. HFA, high-frequency activity; NOE, no odour exposure; POSE, predatory odour stress exposure; PVT, paraventricular thalamic nucleus; sIPSC, spontaneous inhibitory synaptic current.
Fig 3
Fig 3. Long-term behavioural alterations after predatory odour stress exposure.
(A) Scheme of the experiment. Created with BioRender.com. (B, C) Top, Representative horizontal locomotor activity during a 3 h session in 1 EYFP mouse within the home cage during one of the PRE days. Nest onset (NO) and sleep onset (SO) are indicated with black arrows. Bottom, Tracked movements of the same animal in the first hour. The dots show the spatial position of the head of the mouse in every frame. Colour of the dots indicate time elapsed (s), from red to blue; small black rectangle marks the nest area; big black rectangle marks cage area. NO and SO, black arrows. (C) Same as B during a POST day. Head positions outside the cage indicate events when the animal was moving along the edge of its cage. (D) Temporal dynamics of averaged, normalised horizontal locomotor activity of EYFP the animals (n = 14) during the PRE1–5 days (black) vs. the POST1–4 days (red) periods (30 min, t[13] = 2.438; 45 min, t[13] = 2.392). (E) The averaged, normalised horizontal locomotor activity of EYFP the animals before nest onset (W = 85). Dots represent the averaged daily values of individual animals. (F–J) (F) Nest time (t[13] = 3.579), (G) nest building time (W = −89), (H) freezing time (t[13] = 5.692), (I) number of freezing bouts (t[9] = 3.569) and (J) steepness of the NREM EEG spectral slope (t[13] = 1.086) in EYFP animals (n = 14) during the PRE (black dots) and POST (red dots) period. Dots represent the averaged daily values of individual animals. Underlying data can be found in S3 Data. See S10 Data for the full results of the statistical tests. Data are shown as mean ± SEM. *p < 0.05, **p < 0.01, ***p < 0.01, ****p < 0.001. NREM, non-rapid eye movement.
Fig 4
Fig 4. Long-term changes of PVT/CR+ unit activity after predator odour stress exposure.
(A) Scheme of the experiment. Created with BioRender.com. (B) Change in the firing rate of an example PVT/CR+ neuron recorded on PRE 5 day and POST 1 day. (C) Mean firing rate values of PVT/CR+ neurons (n = 126 neurons in 4 animals) during wake, nest, and sleep during the PRE 1–5 and the POST 1–4 days periods. Dots represent individual cells. The data are normalised to the mean wake firing rate of the PRE period (wake, U = 1357, p = 0.0026; nest, U = 1,041, p < 0.0001; sleep U = 1,097, p < 0.0001). (D) Alteration in the state-dependent activity of an example PVT/CR+ neuron recorded on PRE 5 and POST 1 days. (E) SMI in the entire population of PVT/CR+ neurons during PRE and POST periods (wake/nest SMI, U = 1,295, p = 0.0009; wake/sleep SMI, U = 1,304, p = 0.0011; nest/sleep SMI, U = 1,814, P = 0.4576). (F) Change in HFA of an example PVT/CR+ neuron recorded on PRE 5 and POST 1 days. Red lines (spikes) show HFAs, black lines mark the spikes with longer interspike intervals than 10 ms. (G) Frequency of HFAs in the entire PVT/CR+ population during the entire PRE and POST periods (wake, U = 1,309, p = 0.0011; nest, U = 992, p < 0.0001; sleep U = 1,034, p < 0.0001). (H) Alteration in CA between a representative pair of PVT/CR+ neurons recorded on PRE 5 and POST 1 days. Linked red lines (spikes) indicate CAs, black lines mark the spikes occurring outside the time window of 5 ms. (I) Frequency of CA in the entire population of PVT/CR+ cell pairs (n = 448 pairs) during the PRE and POST period. (U = 13,625, p < 0.0001; nest, U = 2,0351, p < 0.0001; sleep U = 20,049, p < 0.0001). Underlying data can be found in S4 Data. See S10 Data for the full results of the statistical tests. Data are shown as mean ± SEM. **p < 0.01, ***p < 0.001, ****p < 0.0001. CA, correlated activity; HFA, high-frequency activity; PVT, paraventricular thalamic nucleus; SMI, state modulation index.
Fig 5
Fig 5. Post-stress photoinhibition of PVT/CR+ neurons prevents stress induced, long-term behavioural changes.
(A) Scheme of the experiment. Created with BioRender.com. (B) Top, Changes in horizontal locomotor activity during 3 h in one SwiChR mouse within the home cage on a PRE day. Nest onset (NO) and sleep onset (SO) are indicated with black arrows. Bottom, Tracked movements of the animal in the first hour. The dots show the spatial position of the head of the mouse in every frame and the colour of the dots indicate lasting time (s), from red to blue; small black rectangle marks the nest area; big black rectangle marks cage area. Nest onset (NO) and sleep onset (SO) are indicated with black arrows. (C) Same as (B) on a POST day. (D) The dynamics of averaged, normalised horizontal locomotor activity (E) of SwiChR mice (n = 7) during the PRE (black) vs. the POST (blue) periods (t[6] = 2.835). (E) Averaged, normalised horizontal locomotor activity of SwiChR mice during the PRE (black) vs. the POST (blue) periods (t[6] = 2.944). (F) Nest time (t[6] = 0.4886), (G) nest building time (t[6] = 0.1084), (H) freezing time (t[6] = 1.142), (I) number of freezing bouts (t[5] = 1.347), and (J) steepness of NREM EEG spectral slope (t[6] = 2.969) in SwiChR mice during the PRE and POST periods. Dots represent the average daily values of individual animals. Underlying data can be found in S5 Data. See S10 Data for the full results of the statistical tests. Data are shown as mean ± SEM. *p < 0.05. NREM, non-rapid eye movement; PVT, paraventricular thalamic nucleus.
Fig 6
Fig 6. Effect of post-stress photoinhibition on long-term changes in PVT/CR+ neuronal activity.
(A) Scheme of the experiment. (B) Post-POSE photoinhibition of PVT/CR+ neurons on POST0 day prevents alterations in the firing rate, (C) SMI, (D) occurrence of HFA, and (E) CA during the PRE (black, n = 38 neurons in 2 mice) vs. the POST (blue, n = 39 in 2 mice) periods (all p > 0.05 unless indicated otherwise). Underlying data can be found in S6 Data. See S10 Data for the full results of the statistical tests. Data are shown as mean ± SEM. *p < 0.05, ***p < 0.001. CA, correlated activity; HFA, high-frequency activity; PVT, paraventricular thalamic nucleus; SMI, state modulation index.
Fig 7
Fig 7. Role of PVT/CR+ neurons in stress-induced molecular changes.
(A) Scheme of the experiments representing the timeline for GABA-A receptor and c-Fos immunostainings. Created with BioRender.com. (B) Top, Representative, low power (upper panel) and high power (bottom panel) confocal images showing c-Fos expression (magenta) in the nucleus accumbens shell (NacS) from Home Cage control, EYFP, and SwiChR mice. Cyan (left) or green (middle and right) indicates CR- or GFP immunostaining, respectively, labelling PVT axons in NacS. (C–G) Quantification of c-Fos positive neurons in (C) PrL, (D) BLA, (E) NacS, and (F) CeA, (G) BNST in Home Cage (n = 7), EYFP (n = 7), SwiChR (n = 6), and NOE (n = 5) mice on POST0 day (PrL, F(3,21) = 17.10, p < 0.0001; BLA, F(3,21) = 7.503, p = 0.0013, NacS, F(3,21) = 14.49, p < 0.0001; CeA, F(3,20) = 4.608, p = 0.0073; oval nucleus of the BNST F(3,20) = 0.848, p = 0.4837). (H) Representative low and high power fluorescent images from the PVT of AAV5-DIO-SwiChRCA-EYFP injected mice. Blue, Hoechst counterstaining. (I, J) Changes in the fluorescence intensity of (H) GABA-A α1 and (I) GABA-A γ2 immunostainings on POST1 day (GABA-A α1, F(2,7) = 23.08, p = 0.0008; GABA-A γ2, F(2,7) = 6.692, p = 0.0237; Home Cage n = 3 mice; EYFP n = 3 mice; SwiChR n = 4 mice). (K) Representative confocal images showing GABA-A α1 and GABA-A γ2 immunostainings in the PVT from Home Cage control, EYFP, and SwiChR mice on POST1 day. Underlying data can be found in S7 Data. See S10 Data for the full results of the statistical tests. Data are shown as mean ± SEM. *p < 0.05, **p < 0.01, ***p < 0.001, ****p < 0.0001. BLA, basolateral amygdala; BNST, bed nucleus of the stria terminalis; CeA, central amydala; NAc, nucleus accumbens; NOE, no odour exposure; PrL, prelimbic cortex; PVT, paraventricular thalamic nucleus.
Fig 8
Fig 8. Effect of late inhibition of PVT/CR+ neurons on stress-induced behavioural changes.
(A) Scheme of the experiment. Created with BioRender.com. (B) Averaged, normalised horizontal activity during the photoinhibition in LATE0 day compared to the preceding day (POST4) (t[6] = 2.474, (n = 7)). (C) Dynamics of averaged, normalised horizontal locomotor activity of SwiChR mice during the POST (POST 1–4 days, red) vs. the LID (LID 1–5 days, blue) periods (15 min, t[6] = 2.738, p = 0.0338; 30 min, t[6] = 2.443, p = 0.0503). (D) Averaged, normalised horizontal locomotor activity of SwiChR mice during the POST (POST 1–4 days, red) vs. the LID (LID 1–5 days, blue) periods (W = −26). (E) Freezing behaviour (t[6] = 6.909, p = 0.0005), (F) nest time (t[6] = 2.031), and (G) nest building time (W = −5) in SwiChR mice during the POST (POST 1–4 days, red dots) and LID (LID 1–5 days, blue dots) periods. Dots represent the average daily values of individual animals. Underlying data can be found in S8 Data. See S10 Data for the full results of the statistical tests. Data are shown as mean ± SEM. Ns means no significant difference between groups, #p < 0.06, *p < 0.05, ***p < 0.001. PVT, paraventricular thalamic nucleus.

Similar articles

Cited by

References

    1. Sanacora G, Yan Z, Popoli M. The stressed synapse 2.0: pathophysiological mechanisms in stress-related neuropsychiatric disorders. Nature Reviews Neuroscience. Nature Research. 2022:86–103. doi: 10.1038/s41583-021-00540-x - DOI - PubMed
    1. Popoli M, Yan Z, McEwen BS, Sanacora G. The stressed synapse: The impact of stress and glucocorticoids on glutamate transmission. Nat Rev Neurosci. 2012;13:22–37. doi: 10.1038/nrn3138 - DOI - PMC - PubMed
    1. Musazzi L, Tornese P, Sala N, Popoli M. Acute or Chronic? A Stressful Question. Trends Neurosci. 2017;40:525–535. doi: 10.1016/j.tins.2017.07.002 - DOI - PubMed
    1. Turrigiano GG, Nelson SB. Homeostatic plasticity in the developing nervous system. Nat Rev Neurosci. 2004;5:97–107. doi: 10.1038/nrn1327 - DOI - PubMed
    1. Turrigiano GG, Leslie KR, Desai NS, Rutherford LC, Nelson SB. Activity-dependent scaling of quantal amplitude in neocortical neurons. Nature. 1998;391:892–896. doi: 10.1038/36103 - DOI - PubMed

LinkOut - more resources