

Estimating the impact of school closures on the COVID-19 dynamics in 74 countries: A modelling analysis
- PMID: 39836691
- PMCID: PMC11793732
- DOI: 10.1371/journal.pmed.1004512
Estimating the impact of school closures on the COVID-19 dynamics in 74 countries: A modelling analysis
Abstract
Background: School closures have been a prominent component of the global Coronavirus Disease 2019 (COVID-19) response. However, their effect on viral transmission, COVID-19 mortality and health care system pressure remains incompletely understood, as traditional observational studies fall short in assessing such population-level impacts.
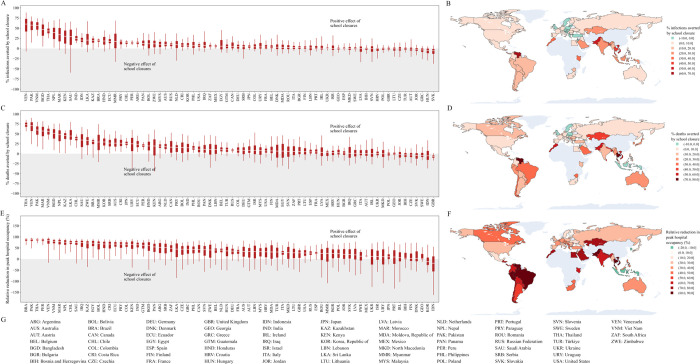
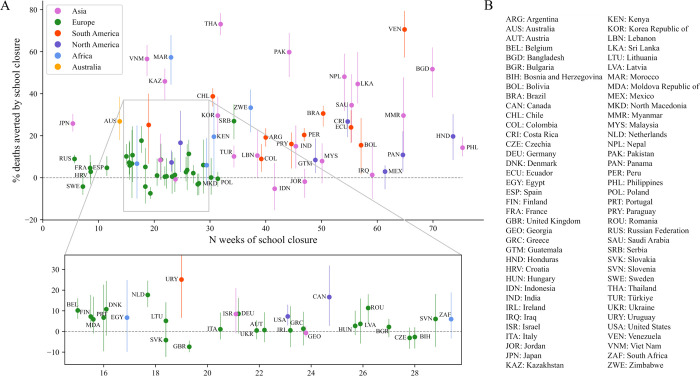
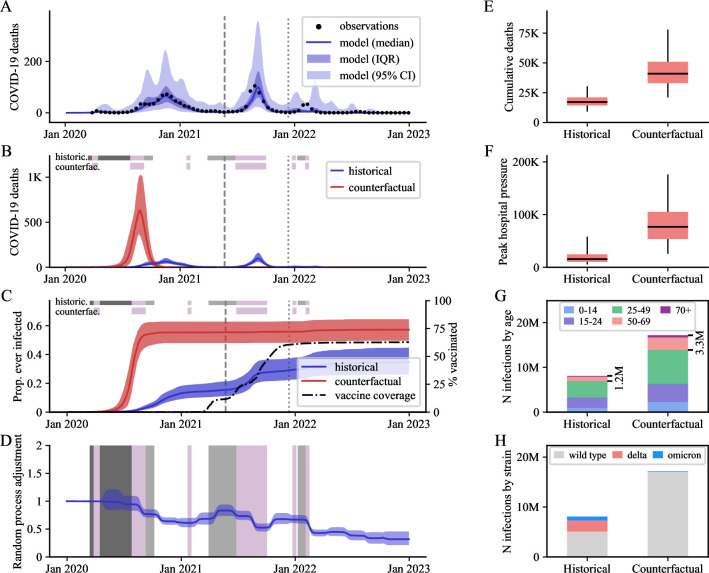
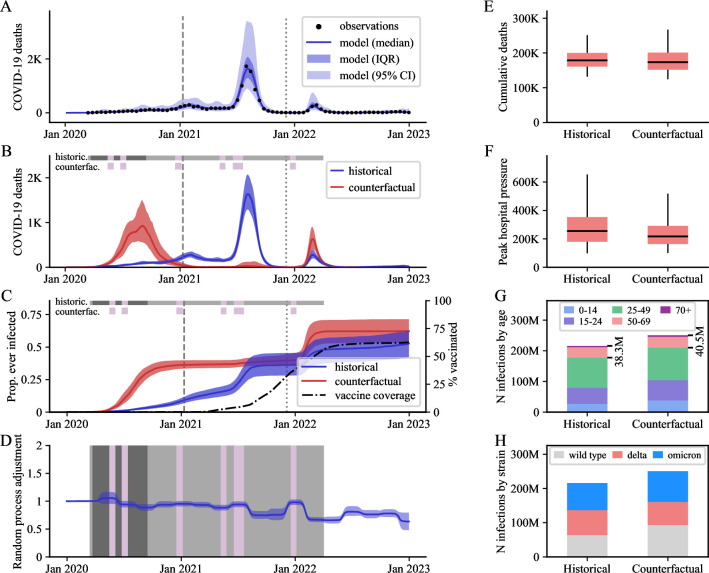
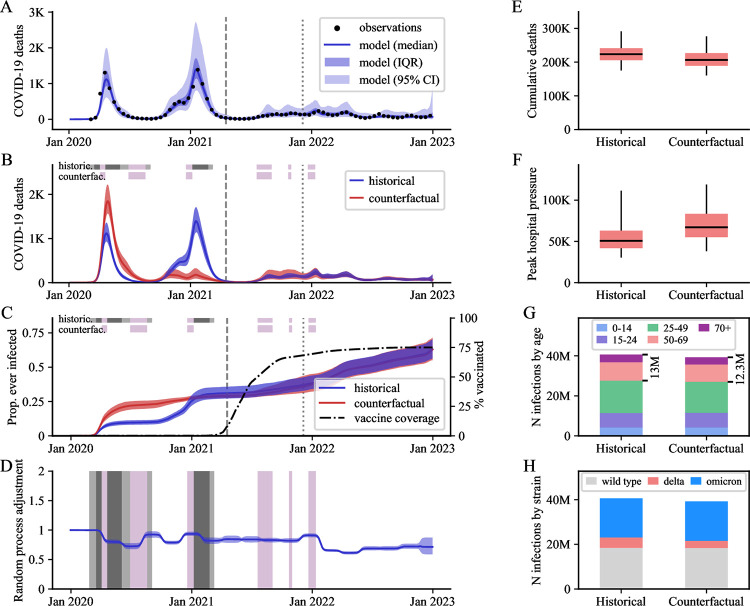
Methods and findings: We used a mathematical model to simulate the COVID-19 epidemics of 74 countries, incorporating observed data from 2020 to 2022 and historical school closure timelines. We then simulated a counterfactual scenario, assuming that schools remained open throughout the study period. We compared the simulated epidemics in terms of Severe Acute Respiratory Syndrome Coronavirus 2 (SARS-CoV-2) infections, deaths, and hospital occupancy pressure. We estimated that school closures achieved moderate to significant burden reductions in most settings over the period 2020 to 2022. They reduced peak hospital occupancy pressure in nearly all countries, with 72 out of 74 countries (97%) showing a positive median estimated effect, and median estimated effect ranging from reducing peak hospital occupancy pressure by 89% in Brazil to increasing it by 19% in Indonesia. The median estimated effect of school closures on COVID-19 deaths ranged from a 73% reduction in Thailand to a 7% increase in the United Kingdom. We estimated that school closures may have increased overall COVID-19 mortality (based on median estimates) in 9 countries (12%), including several European nations and Indonesia. This is attributed to changes in population-level immunity dynamics, leading to a concentration of the epidemic during the Delta variant period, alongside an upward shift in the age distribution of infections. While our estimates were associated with significant uncertainty, our sensitivity analyses exploring the impact of social mixing assumptions revealed robustness in our country-specific conclusions. The main study limitations include the fact that analyses were conducted at the national level, whereas school closure policies often varied by region. Furthermore, some regions, including Africa, were underrepresented due to insufficient data informing the model.
Conclusions: Our analysis revealed nuanced effects of school closures on COVID-19 dynamics, with reductions in COVID-19 impacts in most countries but negative epidemiological effects in a few others. We identified critical mechanisms for consideration in future policy decisions, highlighting the unpredictable nature of emerging variants and potential shifts in infection demographics associated with school closures.
Copyright: © 2025 Ragonnet et al. This is an open access article distributed under the terms of the Creative Commons Attribution License, which permits unrestricted use, distribution, and reproduction in any medium, provided the original author and source are credited.
Conflict of interest statement
The authors have declared that no competing interests exist.
Figures
Similar articles
-
Travel-related control measures to contain the COVID-19 pandemic: a rapid review.Cochrane Database Syst Rev. 2020 Oct 5;10:CD013717. doi: 10.1002/14651858.CD013717. Cochrane Database Syst Rev. 2020. Update in: Cochrane Database Syst Rev. 2021 Mar 25;3:CD013717. doi: 10.1002/14651858.CD013717.pub2. PMID: 33502002 Updated.
-
Quarantine alone or in combination with other public health measures to control COVID-19: a rapid review.Cochrane Database Syst Rev. 2020 Sep 15;9(9):CD013574. doi: 10.1002/14651858.CD013574.pub2. Cochrane Database Syst Rev. 2020. PMID: 33959956 Free PMC article.
-
Global burden of 288 causes of death and life expectancy decomposition in 204 countries and territories and 811 subnational locations, 1990-2021: a systematic analysis for the Global Burden of Disease Study 2021.Lancet. 2024 May 18;403(10440):2100-2132. doi: 10.1016/S0140-6736(24)00367-2. Epub 2024 Apr 3. Lancet. 2024. PMID: 38582094 Free PMC article.
-
International travel-related control measures to contain the COVID-19 pandemic: a rapid review.Cochrane Database Syst Rev. 2021 Mar 25;3(3):CD013717. doi: 10.1002/14651858.CD013717.pub2. Cochrane Database Syst Rev. 2021. PMID: 33763851 Free PMC article.
-
Impact of school closures for COVID-19 on the US health-care workforce and net mortality: a modelling study.Lancet Public Health. 2020 May;5(5):e271-e278. doi: 10.1016/S2468-2667(20)30082-7. Epub 2020 Apr 3. Lancet Public Health. 2020. PMID: 32251626 Free PMC article.
Cited by
-
Trends in antibiotic dispensing for children in Belgian ambulatory care: time series analysis before, during, and after the COVID-19 pandemic.JAC Antimicrob Resist. 2025 Jul 29;7(4):dlaf135. doi: 10.1093/jacamr/dlaf135. eCollection 2025 Aug. JAC Antimicrob Resist. 2025. PMID: 40735513 Free PMC article.
References
-
- Public Health England. Impact of School Closures on an Influenza Pandemic Scientific Evidence Base Review. 2014.
MeSH terms
LinkOut - more resources
Full Text Sources
Medical
Miscellaneous
