

Incompatible Aedes aegypti male releases as an intervention to reduce mosquito population-A field trial in Puerto Rico
- PMID: 39836703
- PMCID: PMC11785262
- DOI: 10.1371/journal.pntd.0012839
Incompatible Aedes aegypti male releases as an intervention to reduce mosquito population-A field trial in Puerto Rico
Abstract
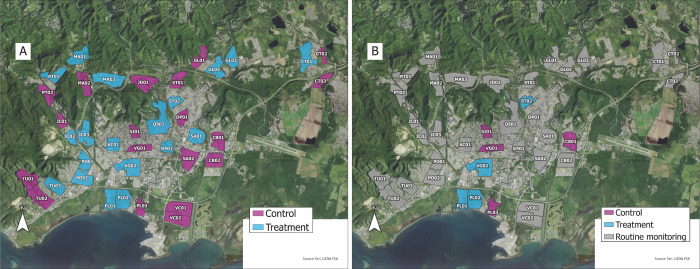
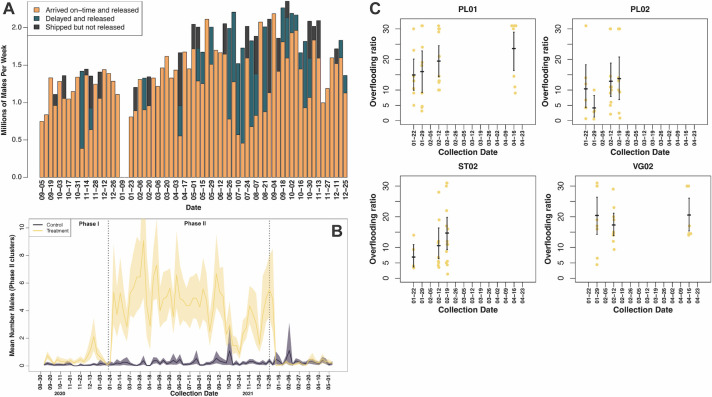
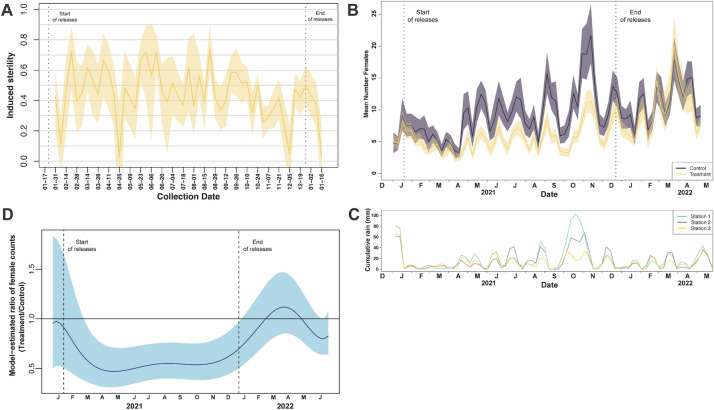
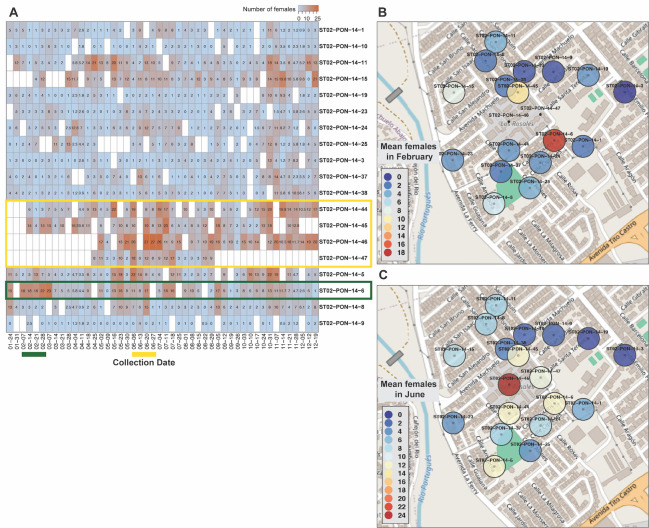
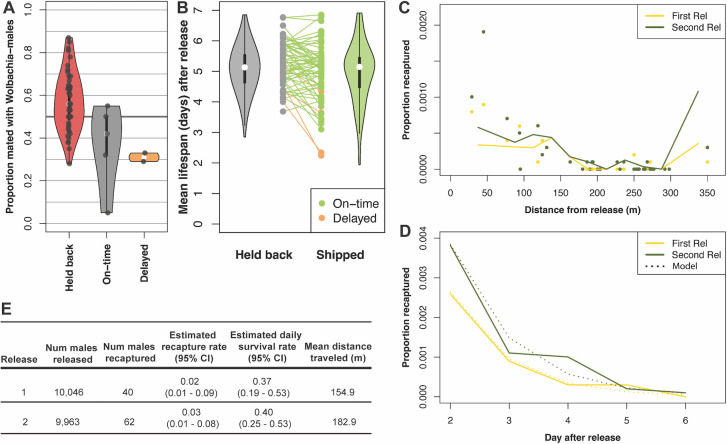
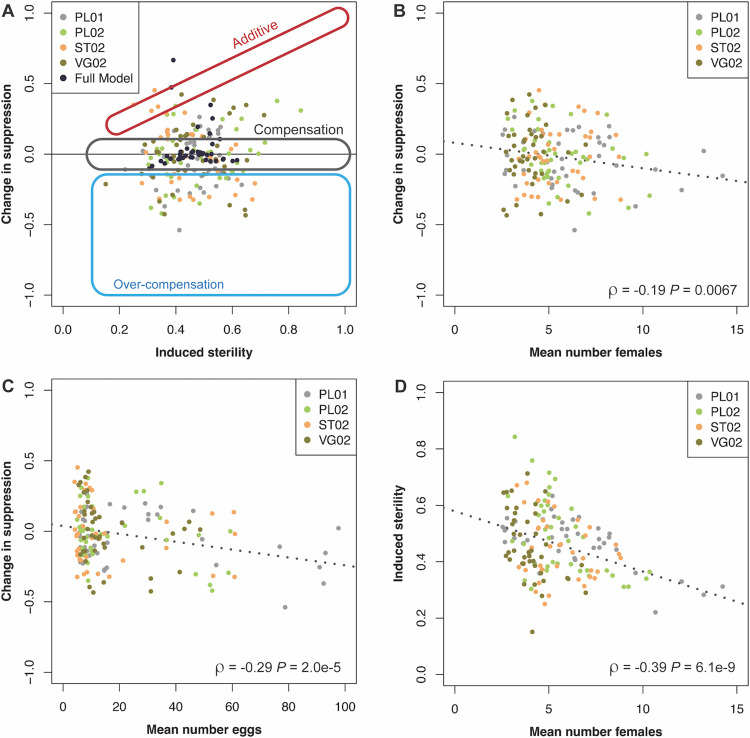
Mosquito-transmitted viruses such as dengue are a global and growing public health challenge. Without widely available vaccines, mosquito control is the primary tool for fighting the spread of these viruses. New mosquito control technologies are needed to complement existing methods, given current challenges with scalability, acceptability, and effectiveness. A field trial was conducted in collaboration with the Communities Organized to Prevent Arboviruses project in Ponce, Puerto Rico, to measure entomological and epidemiological effects of reducing Aedes aegypti populations using Wolbachia incompatible insect technique. We packed and shipped Wolbachia-males from California and released them into 19 treatment clusters from September 2020 to December 2020. Preliminary evaluation revealed sub-optimal Wolbachia-male densities and impact on the wild-type population. In 2021, we shifted to a phased release strategy starting in four clusters, reducing the mosquito population by 49% (CI 29-63%). We describe the investigation into male quality and other factors that may have limited the impact of Wolbachia-male releases. Laboratory assays showed a small but significant impact of packing and shipping on male fitness. However, mark-release-recapture assessments suggest that male daily survival rates in the field may have been significantly impacted. We compared induced-sterility levels and suppression of the wild population and found patterns consistent with mosquito population compensation in response to our intervention. Analysis of epidemiological impact was not possible due to very low viral transmission rates during the intervention period. Our entomological impact data provide evidence that Wolbachia incompatible-male releases reduced Ae. aegypti populations, although efficacy will be maximized when releases are part of an integrated control program. With improvement of shipping vessels and shipped male fitness, packing and shipping male mosquitoes could provide a key solution for expanding access to this technology. Our project underscores the challenges involved in large and complex field effectiveness assessments of novel vector control methods.
Copyright: This is an open access article, free of all copyright, and may be freely reproduced, distributed, transmitted, modified, built upon, or otherwise used by anyone for any lawful purpose. The work is made available under the Creative Commons CC0 public domain dedication.
Conflict of interest statement
I have read the journal’s policy, and the authors of this manuscript have the following competing interests: JEC, SNM, JRO, PIH, CB, BW, CE, and BJW report employment and equity ownership at Verily Life Sciences, a for-profit company developing new technologies for mosquito control.
Figures
Similar articles
-
Mark-Release-Recapture of Packed and Shipped Aedes aegypti with Wolbachia: Implications for Conducting Remote Incompatible Insect Technique Programs.Am J Trop Med Hyg. 2025 Mar 18;112(6):1313-1324. doi: 10.4269/ajtmh.24-0262. Print 2025 Jun 4. Am J Trop Med Hyg. 2025. PMID: 40101296 Free PMC article.
-
Effectiveness of Wolbachia-mediated sterility coupled with sterile insect technique to suppress adult Aedes aegypti populations in Singapore: a synthetic control study.Lancet Planet Health. 2024 Sep;8(9):e617-e628. doi: 10.1016/S2542-5196(24)00169-4. Lancet Planet Health. 2024. PMID: 39243778
-
Effectiveness of Wolbachia-infected mosquito deployments in reducing the incidence of dengue and other Aedes-borne diseases in Niterói, Brazil: A quasi-experimental study.PLoS Negl Trop Dis. 2021 Jul 12;15(7):e0009556. doi: 10.1371/journal.pntd.0009556. eCollection 2021 Jul. PLoS Negl Trop Dis. 2021. PMID: 34252106 Free PMC article.
-
Innovative sterile male release strategies for Aedes mosquito control: progress and challenges in integrating evidence of mosquito population suppression with epidemiological impact.Infect Dis Poverty. 2024 Dec 3;13(1):91. doi: 10.1186/s40249-024-01258-5. Infect Dis Poverty. 2024. PMID: 39627857 Free PMC article. Review.
-
Advancing the art of mosquito control: the journey of the sterile insect technique against Aedes aegypti in Cuba.Infect Dis Poverty. 2024 Aug 29;13(1):61. doi: 10.1186/s40249-024-01224-1. Infect Dis Poverty. 2024. PMID: 39198869 Free PMC article. Review.
Cited by
-
Exploiting Wolbachia as a Tool for Mosquito-Borne Disease Control: Pursuing Efficacy, Safety, and Sustainability.Pathogens. 2025 Mar 14;14(3):285. doi: 10.3390/pathogens14030285. Pathogens. 2025. PMID: 40137770 Free PMC article. Review.
-
Mark-Release-Recapture of Packed and Shipped Aedes aegypti with Wolbachia: Implications for Conducting Remote Incompatible Insect Technique Programs.Am J Trop Med Hyg. 2025 Mar 18;112(6):1313-1324. doi: 10.4269/ajtmh.24-0262. Print 2025 Jun 4. Am J Trop Med Hyg. 2025. PMID: 40101296 Free PMC article.
References
-
- World Health Organization. Vector Borne Diseases. Available from https://www.who.int/news-room/fact-sheets/detail/vector-borne-diseases. Published March 2, 2020. Accesed May 2, 2023.
-
- World Health Organization. Global Arbovirus Initiative. Available from: https://www.who.int/news-room/events/detail/2022/03/31/default-calendar/.... Published March 31, 2022. Accessed May 2, 2023.
MeSH terms
Grants and funding
LinkOut - more resources
Full Text Sources
