. 2025 Jan 21;23(1):e3002982.
doi: 10.1371/journal.pbio.3002982. eCollection 2025 Jan.

Emergence of SARS-CoV-2 subgenomic RNAs that enhance viral fitness and immune evasion

Affiliations

Emergence of SARS-CoV-2 subgenomic RNAs that enhance viral fitness and immune evasion

Harriet V Mears et al. PLoS Biol. .

Abstract

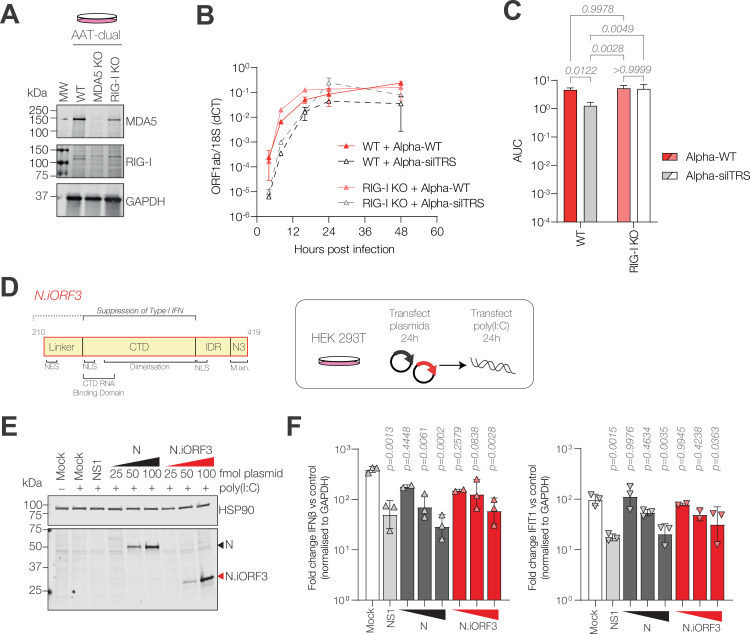
Coronaviruses express their structural and accessory genes via a set of subgenomic RNAs, whose synthesis is directed by transcription regulatory sequences (TRSs) in the 5' genomic leader and upstream of each body open reading frame. In SARS-CoV-2, the TRS has the consensus AAACGAAC; upon searching for emergence of this motif in the global SARS-CoV-2 sequences, we find that it evolves frequently, especially in the 3' end of the genome. We show well-supported examples upstream of the Spike gene-within the nsp16 coding region of ORF1b-which is expressed during human infection, and upstream of the canonical Envelope gene TRS, both of which have evolved convergently in multiple lineages. The most frequent neo-TRS is within the coding region of the Nucleocapsid gene, and is present in virtually all viruses from the B.1.1 lineage, including the variants of concern Alpha, Gamma, Omicron and descendants thereof. Here, we demonstrate that this TRS leads to the expression of a novel subgenomic mRNA encoding a truncated C-terminal portion of Nucleocapsid, which is an antagonist of type I interferon production and contributes to viral fitness during infection. We observe distinct phenotypes when the Nucleocapsid coding sequence is mutated compared to when the TRS alone is ablated. Our findings demonstrate that SARS-CoV-2 is undergoing evolutionary changes at the functional RNA level in addition to the amino acid level.


Conflict of interest statement

I have read the journal’s policy and the authors of this manuscript have the following competing interests: While the authors declare no competing interests directly related to this work, CS receives grants from Bristol Myers Squibb, Ono Pharmaceuticals, Boehringer Ingelheim, Roche-Ventana, Pfizer, and Archer Dx; receives personal fees from Genentech, the Sarah Canon Research Institute, Medicxi, Bicycle Therapeutics, GRAIL, Amgen, AstraZeneca, Bristol Myers Squibb, Illumina, GlaxoSmithKline, MSD, and Roche-Ventana; holds stock options in Apogen Biotech, Epic Biosciences, GRAIL, and Achilles Therapeutics; is a member of a scientific advisory board for Bicycle Therapeutics, GRAIL, Relay Therapeutics, SAGA Diagnostics, and Achilles Therapeutics; is a co-founder of Achilles Therapeutics; receives consulting fees from Genentech, Medicxi, MetaboMed, Novartis, the China Innovation Centre of Roche, and the Sarah Cannon Research Institute; and receives honoraria from Amgen, AstraZeneca, Bristol Myers Squibb, Illumina, and Incyte. DLVB receives grants, paid to their institution, from AstraZeneca and GSK related to COVID-19, and is a member of the UK Genotype-to-Phenotype 2 Consortium. All other authors have declared that no competing interests exist.

Figures

Fig 1
Fig 1. Discontinuous transcription in coronaviruses.
(A) Schematic of the SARS-CoV-2 genome and (B) the mechanism of discontinuous transcription for expression of the structural (S, E, M, N) and accessory genes (yellow highlight). (C) Alignment of TRS-Bs upstream of each of the indicated ORFs, compared to the TRS-L. Regions of homology to the TRS-L are highlighted in blue and downstream homology to the 5′UTR is highlighted in green. TRS, transcription regulatory sequence.
Fig 2
Fig 2. Nucleocapsid R203K, G204R mutations in the SARS-CoV-2 B.1.1 lineage generate a novel TRS-B site and new subgenomic mRNA (sgmRNA).
(A) Frequency of emergence of the TRS-B consensus sequence (AAACGAAC) in the global SARS-CoV-2 population. The most frequent neo-TRS-B, within the nucleocapsid coding region, is highlighted in red. (B) Phylogenetic reconstruction of SARS-CoV-2 evolution in humans, with lineage-defining mutations for B.1.1 indicated. Viruses with N:R203K mutation (B.1.1 and its descendants) are coloured in red. Adapted from Nextstrain [103,104]. (C) Diagrams of nucleocapsid (N, top) and N.iORF3 (bottom) protein domains and sequence alignment of nucleotides 28874−28891, and amino acids 200−215 of N, showing emergence of a new TRS-B motif. Mutations relative to reference are highlighted in red. The N-terminal (NTD), linker, C-terminal (CTD) and N3 domains of nucleocapsid are shown, along with intrinsically disordered regions (IDRs), and the serine-arginine (SR) rich region. (D) The sequence context of the novel N.iORF3 TRS-B (blue highlight), with extended base-pairing to the 5′UTR (green highlight) during (–) strand RNA synthesis (black), and downstream start codon with Kozak context (yellow highlight). (E) Schematic representation of reverse transcription PCR (RT-PCR) analysis of RNA extracted from infected VeroE6 cells at 24 h post-infection or nasopharyngeal swabs, showing positions of primers. (F) RT-PCR detection of canonical nucleocapsid (N) and N.iORF3 sgmRNAs in RNA extracted from infected cells and clinical swabs (numbered 1–48), for SARS-CoV-2 variants as indicated. Data underlying this figure can be found in: https://doi.org/10.25418/crick.27953013.
Fig 3
Fig 3. Convergent evolution of a novel TRS-B within ORF1ab.
(A) Frequency of emergence of the TRS-B consensus sequence (AAACGAAC) in the global SARS-CoV-2 population. (B) Diagram of the nsp16 coding region, including a potential transframe product and sequence alignment of nucleotides 21298−21315, and amino acids 213−229 of nsp16, showing emergence of a new TRS-B sequence. (C) The sequence context of the novel nsp16.iORF sgmRNA, showing TRS-B (blue highlight), extended homology to the 5′UTR (green highlight) during nascent (–) strand RNA synthesis (black), and downstream start codon and Kozak context (yellow highlight). (D) Schematic representation of reverse transcription PCR (RT-PCR) analysis of RNA extracted from nasopharyngeal swabs, showing positions of primers. (E) RT-PCR detection of nsp16.iORF sgmRNA in clinical swabs (numbered 49−60), indicated by purple arrowheads, or Spike sgmRNA, indicated by black arrowheads. C, control PCR without template. (F) Phylogenetic reconstruction of SARS-CoV-2 evolution in humans, with independent emergences of nsp16.iORF TRS sequence with ≥100 descendant genomes highlighted in purple (see S1 Table). Emergence of extended homology to the 5′UTR is indicated with white outline “bullseye” pattern. Data underlying this figure can be found in: https://doi.org/10.25418/crick.27953013.
Fig 4
Fig 4. N.iORF3 sgmRNA and protein are is expressed at low levels in infection.
(A) Schematic representation of reverse transcription qPCR (RT-qPCR) primer probe sets for Envelope (E), Nucleocapsid (N) and N.iORF3 sgmRNAs. (B, C) RT-qPCR analysis of N.iORF3 sgmRNA copy number, expressed as a ratio of E copy number in human clinical swabs (B) and infected cells (C). For clinical swabs, data are means and standard deviations of 4 (EU1/Alpha) or twelve (Delta/Omicron) swab samples per lineage, compared by one-way Brown-Forsythe and Welch ANOVA and Dunnett’s T3 test, to account for unequal variances. For infected VeroE6 cells, data are means and standard deviations of at least three biological replicates, compared to ‘Lineage B’ or to Alpha by one-way ANOVA and Dunnett’s test. P values are shown. (D) Dynamics of viral RNA expression during infection of Alpha in A549-ACE2-TMPRSS2 cells (AAT), showing absolute sgmRNA copy numbers. Data are means and standard deviations of three biological replicates. (E) Western blot analysis of lysates from infected VeroE6 ACE2-TMPRSS2 cells. N.iORF3 is indicated with a red arrowhead. MW, molecular weight marker. Data underlying this figure can be found in: https://doi.org/10.25418/crick.27952842 and https://doi.org/10.25418/crick.27953013.
Fig 5
Fig 5. N.iORF3 leads to the expression of a truncated form of Nucleocapsid and contributes to viral fitness.
(A) Nucleotide and amino acid sequences of reverse-genetics-derived SARS-CoV-2 mutant viruses (upper panel) and schematic of the experimental set-up for viral competition assays (lower panel). (B) Western blot analysis of lysates from infected VeroE6 cells. N.iORF3 is indicated with a red arrowhead. The membrane was re-probed for GAPDH after N, in the same fluorescent channel. MW, molecular weight marker. (C) Replication of reverse-genetics-derived viruses in A549-ACE2-TMPRSS2 (AAT) cells, measured by reverse transcription qPCR (RT-qPCR) against ORF1ab, normalised to actin. Data are means and standard errors of six biological replicates across two independent experiments. ANOVA analyses for individual times post-infection are given in S2 Table. (D) Corresponding area under the curve (AUC) values are means and standard deviations of AUC values from each independent experiment, compared to Alpha-WT infection by one-way ANOVA and Dunnett’s test. P values are shown. (E) Head-to-head competition assays comparing fitness of Alpha-WT and Alpha-silTRS viruses, measured by Illumina sequencing of amplicons spanning the N.iORF3 TRS-B region and expressed as percentage of Alpha-WT reads. Total ORF1ab expression, normalised to actin, is shown on the right y-axis for reference. Data are means and standard deviations of three biological replicates. Data underlying this figure can be found in: https://doi.org/10.25418/crick.27952842 and https://doi.org/10.25418/crick.27953013.
Fig 6
Fig 6. N.iORF3 antagonises interferon induction downstream of RIG-I.
(A) Western blot analysis of lysates from AAT-dual WT, MDA5 KO and RIG-I KO cell lines. (B) Replication of reverse-genetics-derived viruses in WT and RIG-I KO AAT-dual cells, measured by reverse transcription qPCR (RT-qPCR) against ORF1ab, normalised to 18S rRNA. Data are means and standard deviations of three biological replicates. ANOVA analyses for individual times post-infection are given in S3 Table. (C) Corresponding area under the curve (AUC) values, compared by two-way ANOVA with Tukey’s multiple comparisons. P-values are shown. (D) Diagram of N.iORF3 protein, also called N *, showing domains from Nucleocapsid and described functions (left panel) and schematic showing experimental design (right panel). (E) Western blot analysis of N and N.iORF3 expression in transfected HEK293T cells. (F) Expression of IFNb (left panel) and a representative interferon-stimulated gene (IFIT1, right panel), normalised to GAPDH and expressed as fold change in cells transfected with poly(I:C) compared to control cells which were not transfected with poly(I:C), in the presence of increasing concentrations of N- or N.iORF3-expressing plasmids (25, 50 or 100 fmol) or NS1 from influenza A virus as a positive control (100 fmol). Data are means and standard deviations of at least two biological replicates, compared to mock-transfected cells by one-way ANOVA and Dunnett’s test. P-values are shown. Data underlying this figure can be found in: https://doi.org/10.25418/crick.27952842 and https://doi.org/10.25418/crick.27953013.

References

    1. Rambaut A, Holmes EC, O’Toole Á, Hill V, McCrone JT, Ruis C, et al.. A dynamic nomenclature proposal for SARS-CoV-2 lineages to assist genomic epidemiology. Nat Microbiol. 2020;5(11):1403–7. doi: 10.1038/s41564-020-0770-5 - DOI - PMC - PubMed
    1. Gaebler C, Wang Z, Lorenzi JCC, Muecksch F, Finkin S, Tokuyama M, et al.. Evolution of antibody immunity to SARS-CoV-2. bioRxiv. 2021:2020.11.03.367391. doi: 10.1101/2020.11.03.367391 - DOI - PMC - PubMed
    1. Harvey WT, Carabelli AM, Jackson B, Gupta RK, Thomson EC, Harrison EM, et al.. SARS-CoV-2 variants, spike mutations and immune escape. Nat Rev Microbiol. 2021;19(7):409–24. doi: 10.1038/s41579-021-00573-0 - DOI - PMC - PubMed
    1. Mittal A, Khattri A, Verma V. Structural and antigenic variations in the spike protein of emerging SARS-CoV-2 variants. PLoS Pathog. 2022;18(2):e1010260. doi: 10.1371/journal.ppat.1010260 - DOI - PMC - PubMed
    1. Carabelli AM, Peacock TP, Thorne LG, Harvey WT, Hughes J, COVID-19 Genomics UK Consortium, et al.. SARS-CoV-2 variant biology: immune escape, transmission and fitness. Nat Rev Microbiol. 2023;21(3):162–77. doi: 10.1038/s41579-022-00841-7 - DOI - PMC - PubMed