. 2025 Mar 19;113(6):949-961.e3.
doi: 10.1016/j.neuron.2024.12.023. Epub 2025 Jan 20.

Closed-loop modulation of remote hippocampal representations with neurofeedback

Affiliations

Closed-loop modulation of remote hippocampal representations with neurofeedback

Michael E Coulter et al. Neuron. .

Abstract

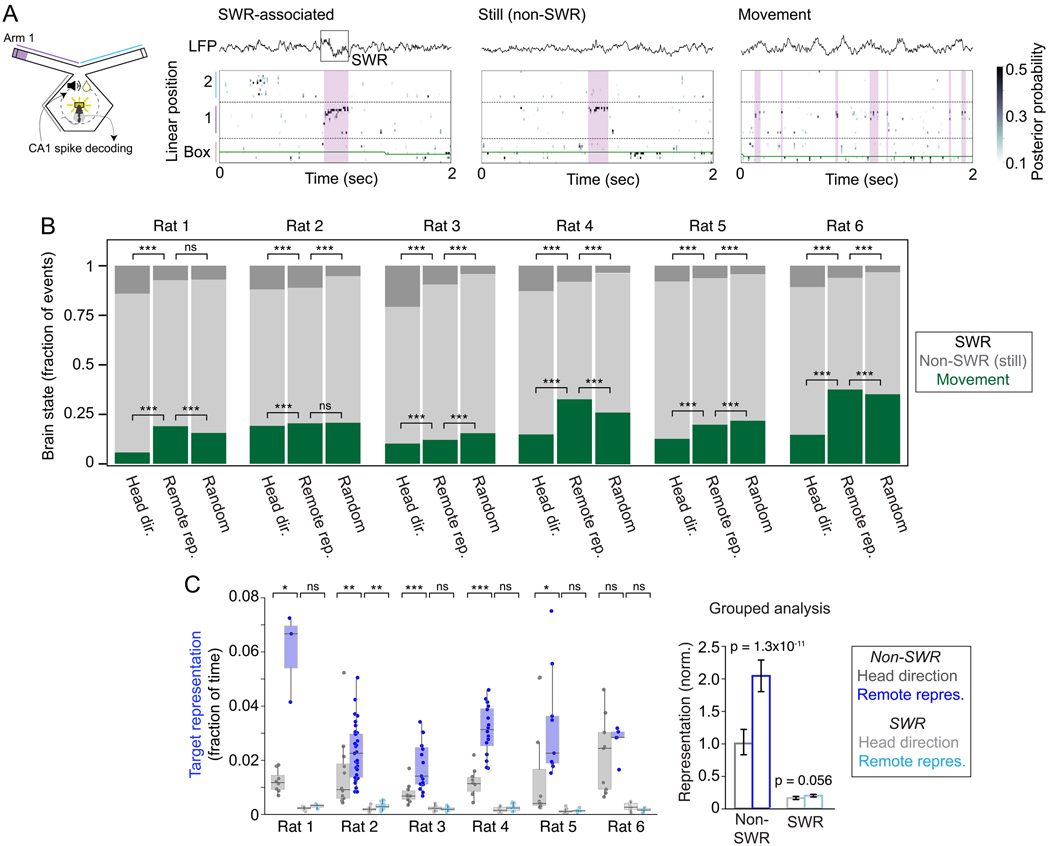
Humans can remember specific remote events without acting on them and influence which memories are retrieved based on internal goals. However, animal models typically present sensory cues to trigger memory retrieval and then assess retrieval based on action. Thus, it is difficult to determine whether measured neural activity patterns relate to the cue(s), the memory, or the behavior. We therefore asked whether retrieval-related neural activity could be generated in animals without cues or a behavioral report. We focused on hippocampal "place cells," which primarily represent the animal's current location (local representations) but can also represent locations away from the animal (remote representations). We developed a neurofeedback system to reward expression of remote representations and found that rats could learn to generate specific spatial representations that often jumped directly to the experimenter-defined target location. Thus, animals can deliberately engage remote representations, enabling direct study of retrieval-related activity in the brain.

Keywords: behavior; brain-machine interface; decoding; hippocampus; memory; neurofeedback; place cells; rat; retrieval; spatial representation.


Conflict of interest statement

Declaration of interests The authors declare no competing interests.

Figures

Figure 1.
Figure 1.. Closed-loop hippocampal feedback system.
(A) The task environment consisted of a central “box” area with a central reward port and two arms, each with a reward port at the end. The end of one of the two arms was used as the target location for neurofeedback in each session. Note that the walls surrounding the central box are opaque. Each task session contained two task phases, exploration and feedback. During the feedback phase, either specific head directions or remote target representation were detected and triggered a tone. A nosepoke at the center well within 3 seconds of the tone then triggered delivery of reward. (B) Clusterless decoding of hippocampal activity accurately tracked the rat’s actual position during movement. During feedback, the decoder detected remote representations that triggered tone and reward.
Figure 2.
Figure 2.. Rewards received during neurofeedback task.
(A) Each rat maximized rewards during some neurofeedback sessions. Maximum of 75 rewards per session.
Figure 3.
Figure 3.. Remote representations jump to target location.
(A) Individual detected remote representations. Representation classification and frequency are noted above each example. Categories: jump (posterior mass >0.4 in 25 cm at the end of the arm), jump and arm base (posterior mass >0.2 in 15 cm at the base of the arm), medium trajectory (representation with significant linear regression covering at least 35 cm in target arm), long trajectory (representation with significant linear regression covering at least 45 cm in target arm). Colored circles on track indicate decoded location of spatial representation. (B) Summary of event classification for all rats. This includes 90 msec before detection. (C) Fraction of detected events with representation of the arm base within the visual field (first 5 cm of arm). (D) Fraction of detected events with representation of the exact reward port location (last 5 cm of arm).
Figure 4.
Figure 4.. Increased hippocampal remote representations during neurofeedback.
(A) Head direction feedback (schematic at left) and example of decoded mental position around the time of a detected correct head direction event (right). (B) Remote representation neurofeedback session (schematic at left) and example of decoded mental position around the time of a remote representation detection event (right). Spatial representation was calculated by counting the number of 6 msec time bins (purple shading) while the rat was near the center reward port (within 17 cm) and >40% of the decoded mental position (posterior mass) matched the specified location. To match the amount of reward for head direction and remote representation conditioning, only sessions when the rats received >90% of the maximum rewards were included. (C) Prevalence of target location representation (25 cm at end of target arm) during high-reward sessions for head direction feedback vs. remote representation feedback sessions for each rat. (D) Prevalence of control location representation (non-rewarded, 25 cm at base of target arm) during high-reward sessions for head direction feedback vs. remote representation feedback sessions for each rat. (E) Grouped analysis across all 6 rats: LME (test variable is session type). Mann-Whitney test (individual rats), *: p<0.05, **: p<0.01, ***: p<0.001. n: see Table S1. Box plots: center line is median, box is inner quartiles, whiskers are full distribution except outliers.
Figure 5.
Figure 5.. Remote hippocampal representations increase over time with neurofeedback.
(A) Target location is the arm end and control location is the arm base. (B) Target location representation prevalence across all remote representation feedback sessions (red) and for control location representations (orange). Colors in top plots represent designated target arm. Line shows linear regression fit; p-value corresponds to the slope of the linear fit. (C) Grouped analysis (linear regression) for normalized data (z-scored) from all 6 rats for target (top) and control locations (bottom). n: see Table S1.
Figure 6.
Figure 6.. Cell assemblies are activated at the time of remote representations.
(A) Individual neurons active at remote representation detection times. For each cell, left: raster plot showing spikes surrounding each detected remote representation (blue arrow); right: place field computed during exploration phase (2D occupancy normalized firing rate, 3 cm2 bins). (B) Target cell assembly. Left: individual cell weights; right: combined location-specific assembly activity. (C) Same plot as (B) for a non-target cell assembly. (D) Example of activation strength for four target assemblies at the time of remote representation detection. Blue diamonds show activity of each target assembly and grey lines indicate detection times. (E) Target assembly activity at time of remote representation detection (blue) compared to random times (black) and to non-target assemblies at detection times (orange) across all sessions. Assemblies with maximum strength > 100. (F) Zoom-in on plot from (D) showing target representation times (grey lines) and assembly activity (blue diamonds). (G) Target assembly activity at time of remote representation (>40% posterior mass in target location) outside of detection events (blue) compared to random times (black) and to non-target assemblies at remote representation times (orange) across all sessions. In (E) and (G), for plotting only, any values less than 1e-4 were set to 1e-4. Mann-Whitney test, **: p < 0.01, ***: p < 0.001. n: see Table S1. Box plots: center line is median, box is inner quartiles, whiskers are full distribution except outliers.
Figure 7.
Figure 7.. Brain state during remote representation.
(A) Example remote representations during SWR, stillness outside of SWR (rat speed < 4cm/sec), and movement (rat speed > 4cm/sec). Left: schematic. Right: example plots; top: LFP trace, bottom: decoded linear position. (B) Summary of brain state during feedback periods. For each rat: remote representation (>40% posterior mass in target location) during head direction feedback, remote representation during neurofeedback, and random times. Chi-squared test and post-hoc z-test of proportions, ***: p<0.001. (C) Change in target representation during SWR-associated and non-SWR times for neurofeedback sessions compared to head direction feedback sessions. Similar analysis to Figure 4C. Grouped analysis (LME) for 6 rats. Mann-Whitney test (individual rats), *: p<0.05, **: p<0.01, ***: p<0.001. n: see Table S1. Box plots: center line is median, box is inner quartiles, whiskers are full distribution except outliers.

Update of

References

    1. Tarder-Stoll H, Jayakumar M, Dimsdale-Zucker HR, Günseli E, and Aly M. (2020). Dynamic internal states shape memory retrieval. Neuropsychologia 138, 107328. 10.1016/j.neuropsychologia.2019.107328. - DOI - PubMed
    1. Mildner JN, and Tamir DI. (2019). Spontaneous Thought as an Unconstrained Memory Process. Trends Neurosci. 42, 763–777. 10.1016/j.tins.2019.09.001. - DOI - PubMed
    1. Howard MW, and Eichenbaum H. (2015). Time and space in the hippocampus. Brain Res. 1621, 345–354. 10.1016/j.brainres.2014.10.069. - DOI - PMC - PubMed
    1. Maren S., Phan KL., and Liberzon I. (2013). The contextual brain: implications for fear conditioning, extinction and psychopathology. Nat Rev Neurosci 14, 417–428. 10.1038/nrn3492. - DOI - PMC - PubMed
    1. Anagnostaras SG, Gale GD, and Fanselow MS. (2001). Hippocampus and contextual fear conditioning: recent controversies and advances. Hippocampus 11, 8–17. - PubMed

LinkOut - more resources