. 2025 Jan 21;16(1):904.
doi: 10.1038/s41467-025-56212-2.

Multiomic analysis reveals cellular, transcriptomic and epigenetic changes in intestinal pouches of ulcerative colitis patients

Affiliations

Multiomic analysis reveals cellular, transcriptomic and epigenetic changes in intestinal pouches of ulcerative colitis patients

Yu Zhao et al. Nat Commun. .

Abstract

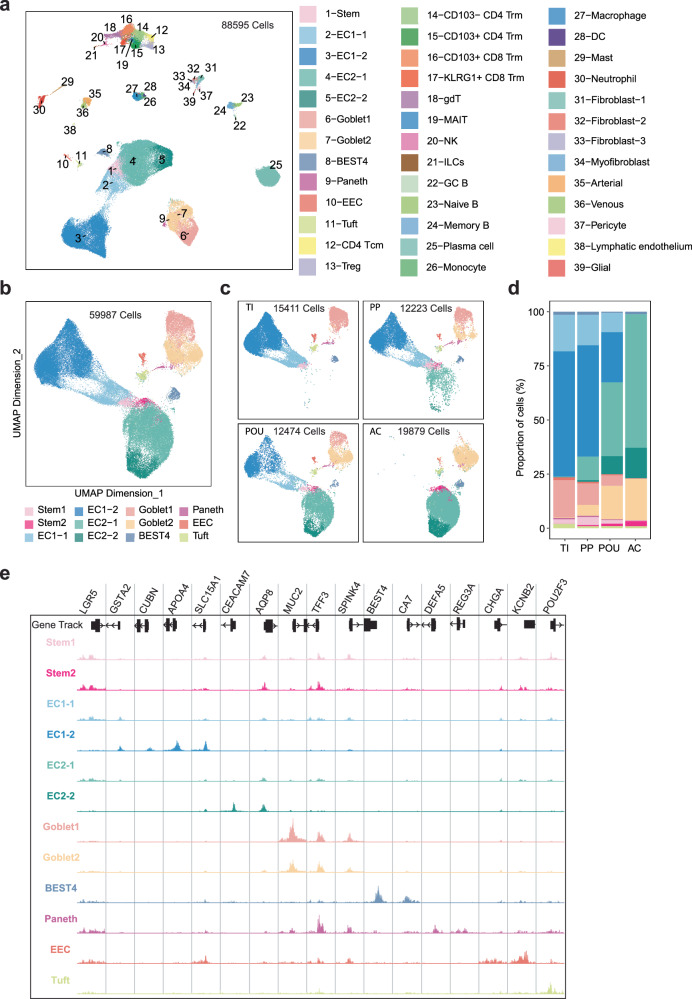
Total proctocolectomy with ileal pouch anal anastomosis is the standard of care for patients with severe ulcerative colitis. We generated a cell-type-resolved transcriptional and epigenetic atlas of ileal pouches using scRNA-seq and scATAC-seq data from paired biopsy samples of the ileal pouch and the ileal segment above the pouch (pre-pouch) from patients (male=4, female=2), and paired biopsies of the terminal ileum and ascending colon from healthy individuals (male=3, female=3) serving as reference. Our study finds an additional population of absorptive and secretory epithelial cells within the pouch but not the pre-pouch. These pouch-specific enterocytes express a subset of colon-specific genes, including CEACAM5 and CD24. However, compared to normal colonocytes, expression of these genes is lower, and these enterocytes also express inflammatory and secretory genes while maintaining expression of some ileal-specific genes. This cell-type-resolved transcriptomic and epigenetic atlas of the ileal pouch establishes a reference for investigating pouch physiology and pathology.


Conflict of interest statement

Competing interests: The authors declare no competing interests.

Figures

Fig. 1
Fig. 1. Overview for the scRNA-seq profiling of 24 human intestinal biopsies from 4 different anatomical regions.
a Schematic of biopsy sampling strategy for scRNA-seq. We profiled 6 pairs of terminal ileum (TI) and ascending colon (AC) biopsies from 6 healthy individuals, and 6 pairs of pre-pouch (PP) and pouch (POU) biopsies from 6 different healthy IPAA patients. Parts of the image were created in BioRender. ZHAO, Y. (2024) https://BioRender.com/b75p140. b UMAP dimensionality reduction of 5 major cell lineages in all 24 samples. c High-resolution UMAP showing 47 cell types in 24 biopsies. d Heatmap of top 10 differentially expressed genes and representative cell markers for each cell type within a lineage. Mean expression in each cell type was scaled as z score in each row across all cell types.
Fig. 2
Fig. 2. Identification of both ileum-like enterocytes and colon-like enterocytes in pouch.
a Harmony-corrected UMAP of 59,751 cells in epithelial lineage. There are two different populations of enterocytes: ileum-like EC1 and colon-like EC2. EC1-2 and EC2-2 are more mature than EC1-1 and EC2-1 respectively. b Harmony corrected UMAP of epithelial cells split based on the four different anatomical regions. c Proportions of different cell types in each region. d Enterocytes are split into 5 groups: AC EC2, TI EC1, pre-pouch EC1, pouch EC1, and pouch EC2. The DEGs were further grouped into 10 different clusters by the set operations of different contrasts, as summarized in the table. Union of sets (∪) Intersection of sets (∩) Difference of sets (–). e Heatmap showing pathway enrichment score in 5 enterocyte groups. The score is scaled across enterocyte groups in each column. f AUC enrichment score for antimicrobial humoral response and lipid metabolism-related pathway activity. The analysis was conducted between single cells from two cell populations, with each single cell considered a biological replicate. The number of cells in each group is as follows: AC (7072), pouch EC2 (3523), pouch EC1 (3581), PP (7327), TI (17,633). Statistical significance was assessed using a two-sided Wilcoxon rank-sum test. Notably, all significance tests labeled in the two panels yielded p-values below 2.22 × 10−16, corresponding to the limit of floating-point precision in R. Source data are provided as a Source Data file.
Fig. 3
Fig. 3. Heatmap showing key differentially expressed genes between cell populations.
a pouch EC2 vs AC EC2. b pouch Goblet2 and AC Goblet. Selected genes were reported in a previous study (Smillie et al.). Pink bars on top are the number of cells in each sample of the corresponding cell type. Expression is scaled in each row across all samples. The last row shows the histological enteritis score of the sample, as also shown in Fig. 4b.
Fig. 4
Fig. 4. Validation of a metaplastic enterocyte population in UC pouches.
a Representative immunohistochemistry images from pre-pouch and pouch biopsies for H&E, FABP6, CEACAM5, and CA2 staining. We found evidence of FABP6 or APOA4 expression, small intestinal markers, in 5/5 pouch samples. 4/5 pouch samples showed expression of CEACAM5 (colonic marker), and 1/5 pouch samples showed expression of CA2 (colonic marker). Experiments to titrate antibodies and validate the specificity of labeling were performed on ileal or ascending colonic biopsies collected from 2 patients (Supplementary Data 6). b Histological enteritis score of pre-pouch and pouch samples. c, d Average gene expression in the bulk RNA-seq data from healthy pouches (c) patients and in pouches from patients who developed pouchitis (d). Expression for each gene is scaled across pre-pouch and pouch. e, f Cell type proportions predicted from bulk RNA-seq data in healthy pouches (e) and in pouches from patients who developed pouchitis (f). Source data are provided as a Source Data file.
Fig. 5
Fig. 5. scATAC-seq profiling of the same group of 24 biopsies studied in scRNA-seq.
a Harmony-corrected UMAP and clustering based on single-cell chromatin accessibility identifies 39 distinct cell types from 88,595 cells across all lineages. b Harmony corrected UMAP of the epithelial lineages includes all cell types identified in scRNA-seq analysis. c Epithelial UMAP split based on four sampling locations. d Proportions of cell types in each region. e Normalized accessibility in promoter regions of cell- type-specific marker genes. Source data are provided as a Source Data file.
Fig. 6
Fig. 6. Identification of marker peaks and transcription factors (TFs) in each cell type in epithelial lineage.
a Marker peaks for each cell type in epithelial lineage. Accessibility is scaled in each column across cell types. b Transcription factors enriched in each cell type. Enrichment was assessed using the hypergeometric test (one-sided), with p-values adjusted using the Bonferroni correction to account for multiple comparisons. c Differentially accessible regions in AC EC2 vs TI EC1 and pouch EC2 vs pouch EC1. d Stacked violin plot shows the RNA expression of different TFs in each enterocyte group. e Heatmap shows the scaled mean ChromVar TF activity score in each enterocyte group. The score is scaled in each row across enterocyte groups (left). TF activity in EC1 lineage and EC2 lineage along inferred differentiation pseudotime (middle, right).
Fig. 7
Fig. 7. Construction of TF-gene regulatory network in pouch enterocytes by peak-gene linkages based on multiomic analysis.
a 31,808 peak-gene links are identified based on the correlation of gene expression and peak accessibility with a correlation score cutoff > 0.6. b Peaks highly correlated with CA2 gene expression show higher accessibility in colon and pouch EC2 enterocytes (highlighted by arrows). c TF-gene regulatory network shows that the TFs (red nodes) are dominating different groups of genes in pouch EC1 and EC2.

Update of

References

    1. Fazio, V. W. et al. Ileal pouch anal Anastomosis: Analysis of outcome and quality of life in 3707 patients. Ann. Surg.257, 679 (2013). - PubMed
    1. Mitsialis, V. et al. Single-cell analyses of colon and blood reveal distinct immune cell signatures of ulcerative colitis and crohn’s disease. Gastroenterology159, 591–608 (2020). - PMC - PubMed
    1. Toritani, K. et al. Inflammatory bowel disease-specific findings are common morphological changes in the ileal pouch with ulcerative colitis. Sci. Rep.12, 20361 (2022). - PMC - PubMed
    1. Ettorre, G. M. et al. Mucosal changes in ileal pouches after restorative proctocolectomy for ulcerative and Crohn’s colitis. Dis. Colon Rectum43, 1743–1748 (2000). - PubMed
    1. Hoda, K. M., Collins, J. F., Knigge, K. L. & Deveney, K. E. Predictors of pouchitis after ileal pouch-anal anastomosis: a retrospective review. Dis. Colon Rectum51, 554–560 (2008). - PubMed

MeSH terms

LinkOut - more resources