. 2025 Jan 21;16(1):892.
doi: 10.1038/s41467-024-54871-1.

iDIA-QC: AI-empowered data-independent acquisition mass spectrometry-based quality control

Affiliations

iDIA-QC: AI-empowered data-independent acquisition mass spectrometry-based quality control

Huanhuan Gao et al. Nat Commun. .

Abstract

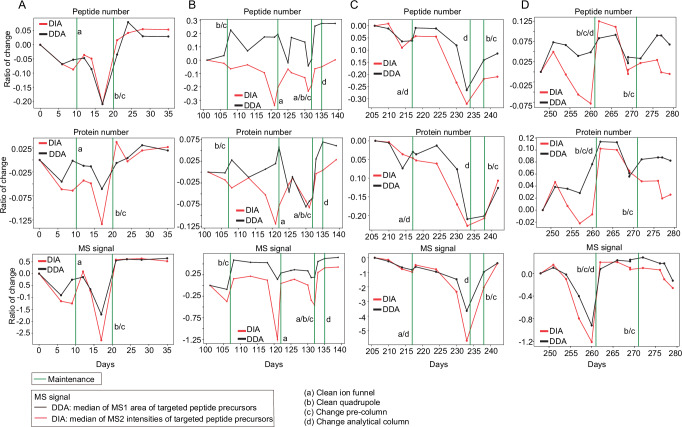
Quality control (QC) in mass spectrometry (MS)-based proteomics is mainly based on data-dependent acquisition (DDA) analysis of standard samples. Here, we collect 2754 files acquired by data independent acquisition (DIA) and paired 2638 DDA files from mouse liver digests using 21 mass spectrometers across nine laboratories over 31 months. Our data demonstrate that DIA-based LC-MS/MS-related consensus QC metrics exhibit higher sensitivity compared to DDA-based QC metrics in detecting changes in LC-MS status. We then prioritize 15 metrics and invite 21 experts to manually assess the quality of 2754 DIA files based on those metrics. We develop an AI model for DIA-based QC using 2110 training files. It achieves AUCs of 0.91 (LC) and 0.97 (MS) in the first validation dataset (n = 528), and 0.78 (LC) and 0.94 (MS) in an independent validation dataset (n = 116). Finally, we develop an offline software called iDIA-QC for convenient adoption of this methodology.


Conflict of interest statement

Competing interests: T.G. and Y. Zhu are shareholders of Westlake Omics Biotechnology Co., Ltd. Three patents related to iDIA-QC technologies have been filed. Two have been granted, with the numbers CN 114858958 B and CN 116106464 B, while the third is currently pending, with the application number CN 202210783026.2. Y.L., Z.N. and Y.L. are employees of Westlake Omics Inc. H.F. and M.C. are employees of Shanghai Luming Biological Technology Inc. Q.F. and J.T. are employees of Shanghai Applied Protein Technology co. ltd. C.C., X.L., X.L. and F.K. were employees of SCIEX China during this project. Z.G., Y. Q. and T.T. are employees of Thermo Fisher Scientific China while R.W., X.D., L.M. and M.W. are employees of Bruker Daltonics China. The remaining authors declare no competing interests.

Figures

Fig. 1
Fig. 1. Schematic overview of the study.
A Generation of 2754 annotated DIA files using 21 mass spectrometers of eight types from nine platforms. B Peptide precursors pre-selection from retrospective datasets of 221 DIA files. C Establishment of a machine learning model for quality control of DIA-based proteomics. FWHM full width at half maximum, RT retention time, PIC precursor ion chromatogram.
Fig. 2
Fig. 2. Longitudinal monitoring of 21 MS instruments.
A The landscape of 2638 DIA files and 785 LC-MS maintenance events for 21 MS instruments over 873 days of data acquisition. Each MS instrument is represented by two circles of the same color, with the acquired DIA files shown as triangles positioned at the outermost part of the circle. The circles in different colors represent different instruments. The varied sizes of rings in the innermost circle represent the number of maintenance events performed on each day. The icons, distinguished by their colors and shapes, represent different types of maintenance. D, timsTOF Pro; W, TripleTOF series; R, Orbitrap series instruments. Bar chart (B) shows the frequency of LC-MS maintenance events for each instrument. Box plot (C) illustrates the distribution of identified proteins across the 2638 DIA files for the 21 MS instruments. The boxes, displayed in various colors, represent different types of instruments. Boxes are first and third quartiles, the center line is median, whiskers are ± 1.5 interquartile range, and dots are individual data points. Source data are provided with this paper.
Fig. 3
Fig. 3. DIA-based QC metric is more sensitive than DDA-based QC metric in detecting data changes.
AD Illustrates four distinct time periods, each randomly selected by the QE-HF X instrument’s longitudinal monitoring system, spanning 0 to 280 days. Each period lasts between 30 and 40 days and highlights various maintenance activities conducted during these intervals. For each time period, we selected three metrics to characterize the differences between DDA and DIA: peptide number, protein number, and MS signal. The MS signal is represented by the MS1 area from the DDA files and the MS2 intensities from the DIA files. The y-axis of each figure represents the ratio of metric values between selected raw files collected at time points n and 1. The ratio of change is calculated as follows: Ratio of change = (Yn - Y1)/Yn. The green vertical lines represent the types of instrument maintenance, which include the following four categories: a) Clean ion funnel, b) Clean quadrupole, c) Change pre-column, and d) Change analytical column. The red line indicates the performance of the current metric in DIA, while the black line represents its performance in DDA. Detailed information about the metric values is provided in the titles of each figure. For instance, in the first row of three figures, the red line represents the number of peptide identifications for DIA in each time period. Source data are provided with this paper.
Fig. 4
Fig. 4. Selecting metrics for data annotation.
Flowchart (A) depicts the selection of 15 metrics used in this study. B Description of the 15 metrics used in the annotationg DIA files. F15*: F15 reserved exclusively for evaluation of timsTOF Pro instruments.
Fig. 5
Fig. 5. Annotation of metrics for 2638 DIA files by 21 experts.
A Sankey diagram illustrates the relationship between instrument configuration issues and the metrics. Different flows are associated with various issues that contribute to a decline in instrument performance. B displays a heatmap illustrating the distribution of the 21 raters across the 21 instruments. The letters in panel (B) represent abbreviations for the experts who annotated the raw files. Panel (C) shows the observed agreement values among 11 technical replicates. Panels (D) and (E) depict the frequency of agreement among raters on 17 metrics, categorized by four and five raters’ instruments, respectively. In (D and E), the differently colored bar charts represent the proportions of the same labels for various sample sizes (2, 3, 4 or 5 people). Source data are provided with this paper.
Fig. 6
Fig. 6. Peptide precursor candidates’ selection, classifier development, performance evaluation, and validation in two independent blinded test datasets.
A Workflow for selecting peptide candidates. B Workflow for developing the classifier, including training, and testing of the LC and MS models using 20 features based on the XGBoost algorithm. C Importance distribution of the 20 features in the LC model. D Importance distribution of the 20 features in the MS model. E Receiver operating characteristic (ROC) curves for the LC model with three features in the 1st validation dataset. F ROC curves for the MS model with 12 features in the 1st validation dataset. G ROC curves for the LC model with three features in the 2nd validation dataset. H ROC curves for the MS model with 12 features in the 2nd validation dataset. I Physicochemical properties of the 33 peptides selected both in the LC and MS models. In figures (EH), the differently colored lines represent the AUC curves for various features across the models. Source data are provided with this paper.

Similar articles

References

    1. Domon, B. & Aebersold, R. Options and considerations when selecting a quantitative proteomics strategy. Nat. Biotechnol.28, 710–721 (2010). - PubMed
    1. Xiao, Q. et al. High-throughput proteomics and AI for cancer biomarker discovery. Adv. Drug Deliv. Rev.176, 113844 (2021). - PubMed
    1. Aebersold, R. & Mann, M. Mass-spectrometric exploration of proteome structure and function. Nature537, 347–355 (2016). - PubMed
    1. Mann, M. Comparative analysis to guide quality improvements in proteomics. Nat. Methods6, 717–719 (2009). - PubMed
    1. Bittremieux, W. et al. Quality control in mass spectrometry-based proteomics. Mass Spectrom. Rev.37, 697–711 (2018). - PubMed

LinkOut - more resources