. 2025 Jan 21;16(1):899.
doi: 10.1038/s41467-025-56257-3.

Barcoded screening identifies nanocarriers for protein delivery to kidney

Affiliations

Barcoded screening identifies nanocarriers for protein delivery to kidney

Luyao Wang et al. Nat Commun. .

Abstract

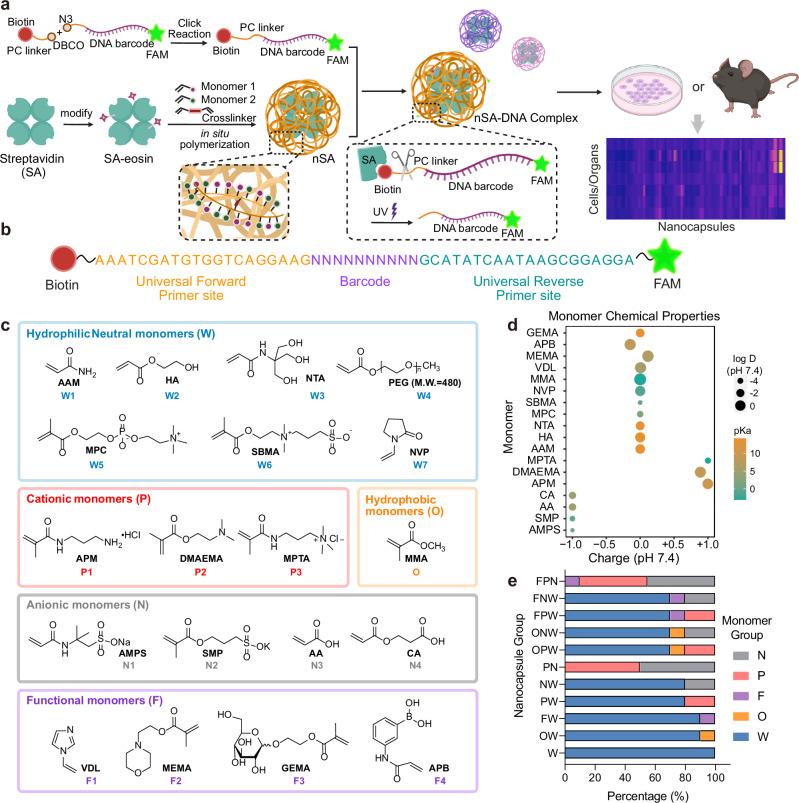
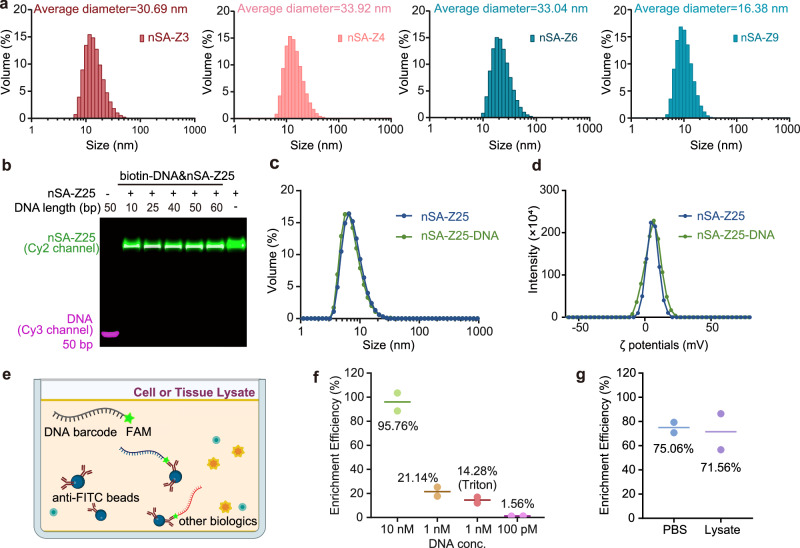
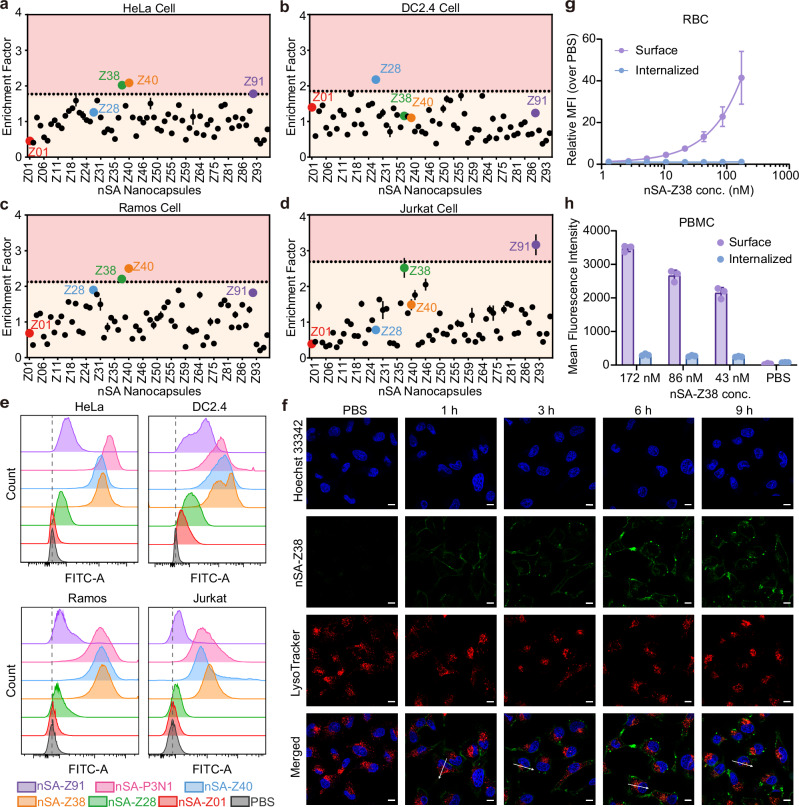
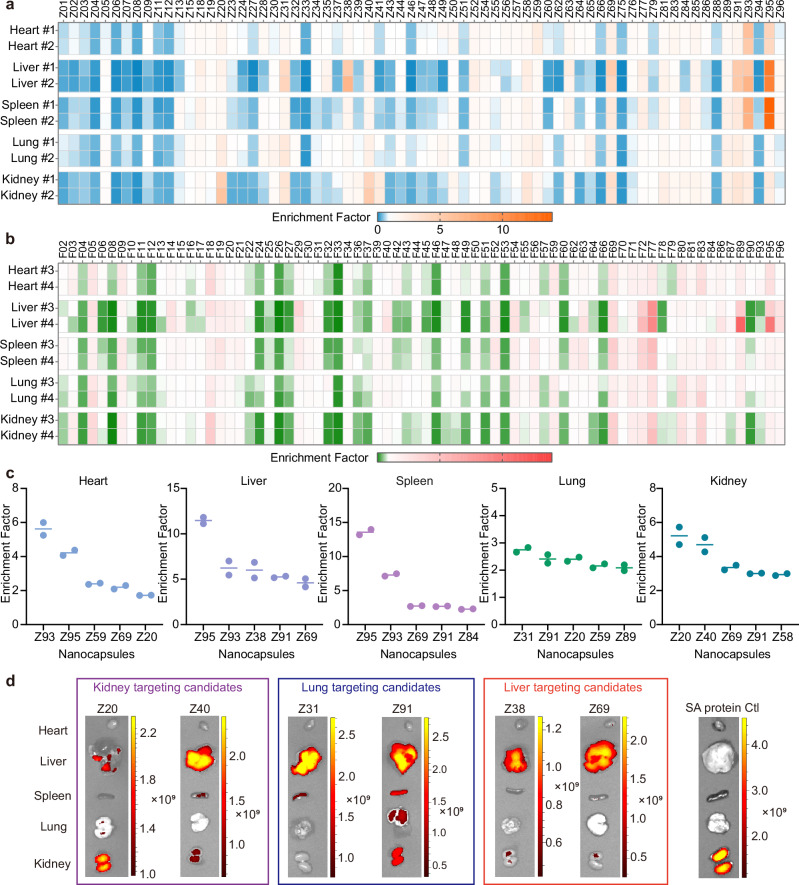
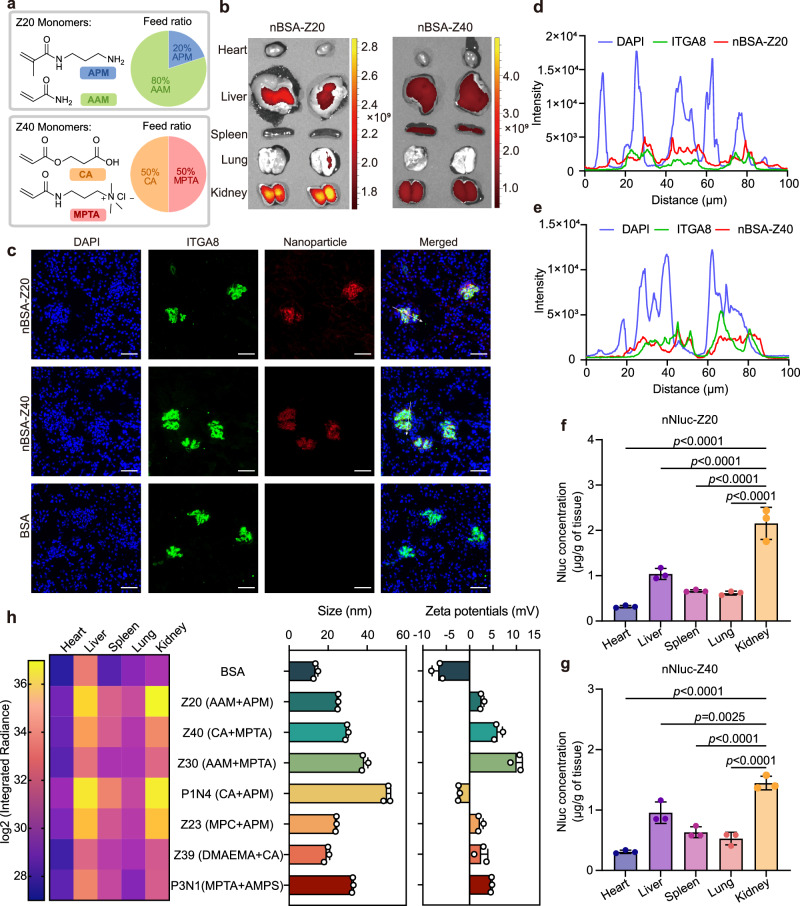
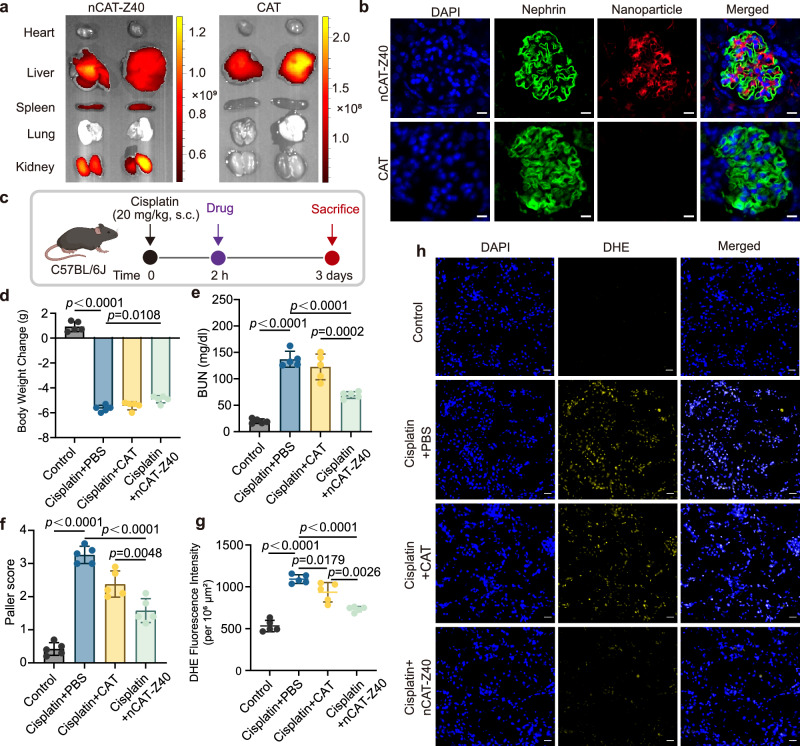
Targeted protein delivery with nanocarriers holds significant potential to enhance therapeutic outcomes by precisely directing proteins to specific organs or tissues. However, the complex interactions between nanocarriers and the biological environment pose considerable challenges in designing effective targeted delivery vehicles. In this study, we address this challenge by leveraging DNA-barcoded high-throughput screening. We construct a nanocapsule library via in-situ polymerization, incorporating various monomers to create nanocapsules with unique surface properties. In vitro and in vivo screening, using female mice, identify nanocapsules with high cell association and different biodistribution. Our investigation into kidney-enriched nanocapsules highlights the crucial role of polymer composition in biodistribution, demonstrating the potential of surface engineering for precise control over nanoparticle distribution. The kidney-enriched nanocapsule successfully delivers catalase, showcasing its therapeutic potential in mitigating cisplatin-induced acute kidney injury. Overall, our study presents an approach for identifying protein delivery vehicles, with the capacity to broaden the application of proteins as therapeutic agents or research tools.


Conflict of interest statement

Competing interests: The authors declare no competing interest.

Figures

Fig. 1
Fig. 1. The design of the DNA-barcoded screening and the nanocapsule library.
a The schematic illustration of the synthesis, screening, and barcode reading. The illustration was created in BioRender. Wang, L. (2025) https://BioRender.com/a96u763. b The design of the DNA barcodes. c Monomers used for the synthesis of the nanocapsule library. The monomers are classified into five categories: hydrophilic neutral monomers (W), hydrophobic neutral monomers (O), positively charged monomers (P), negatively charged monomers (N), and functional monomers (F). d The predicted pKa, log D (pH 7.4), and charge (pH 7.4) of the monomers. MMA does not possess pKa value. MPTA does not possess the pKa or logD values. e The monomer molar ratio added to the polymerization reactions for nanocapsule syntheses. Source data are provided as a Source Data file.
Fig. 2
Fig. 2. Nanocapsule library characterization and barcode incorporation and extraction efficiency.
a The size distribution of selected nSAs. b The agarose gel electrophoresis images of nSA-Z25 in complex with biotin-DNA oligomers with different lengths at a 1:1 mol ratio. The nSA-Z25 was visualized with Typhoon RGB (Cy2 channel). DNA was stained with gel red and imaged using the Cy3 channel. This experiment was repeated independently three times with similar results. c The size distributions of nSA-Z25 and nSA-Z25-DNA complex. d The ζ potentials of nSA-Z25 and nSA-Z25-DNA complex. e The schematic illustration of the method to enrich 3’-FAM-labeled DNA barcodes with anti-FITC magnetic beads (Created in BioRender. Wang, L. (2025) https://BioRender.com/a96u763). f The enrichment efficiency of biotin-DNA at different concentrations with anti-FITC magnetic beads. Data are presented as mean with individual data points. n = 2. g The enrichment efficiency of nSA-biotin-DNA complex at 40 nM concentration in PBS buffer or 293 T cell lysate using anti-FITC magnetic beads. Data are presented as mean with individual data points. n = 2. Source data are provided as a Source Data file.
Fig. 3
Fig. 3. In vitro screening identified nanocapsules that strongly interacted with cells.
ad The enrichment factor of each nanoparticle after incubation with (a) HeLa cell, (b) DC2.4 cell, (c) Ramos cell, and (d) Jurkat cell. Data are presented as mean with range. n = 2. e Flow cytometry analysis of HeLa, DC2.4, Ramos, and Jurkat cells after the treatment with 430 nM fluorescently labeled nSA-Z28 (P2W5), nSA-Z38 (P3N3), nSA-Z40 (P3N4), nSA-Z91 (F3P3N4) and nSA-P3N1 for 24 h. f Confocal microscope images of HeLa cells after treatment with nSA-Z38 at 37 °C for different periods. This experiment was repeated independently three times with similar results. Scale bar = 10 μm. White arrows were used for colocalization analysis (Supplementary Fig. 5b). g Surface-bound and internalized nSA-Z38 in red blood cells after incubation at 37 °C for 1 h. Data are presented as mean ± s.d. n = 3. h The Surface-bound and internalized nSA-Z38 in mouse peripheral blood mononuclear cells (PBMCs) at different concentrations (172 nM, 86 nM, and 43 nM). Data are presented as mean ± s.d. n = 3. The n represents biologically independent replicates (g, h). Source data are provided as a Source Data file.
Fig. 4
Fig. 4. The in vivo screening results of nanocapsule libraries.
a, b The DNA barcode enrichment factors in the heart, liver, spleen, lung, and kidney from mice 24 h after the tail vein injection of the nanocapsule combination libraries (n = 2). c The enrichment factors of the Top 5 enriched nanoparticles in each organ from Library Z. Data are presented as mean with individual data points. n = 2. The n represents biologically independent replicates. d Representative ex vivo fluorescent images of major organs from mice 24 h after tail-vein injection with nSA-Z38, nSA-Z69, nSA-Z31, nSA-Z91, nSA-Z20, nSA-Z40, and streptavidin (SA) (100 μL, 8.6 μM) labeled with biotin-Cy5. Source data are provided as a Source Data file.
Fig. 5
Fig. 5. The kidney accumulation potentials of nBSA-Z20, nBSA-Z40, and other selected nanocapsules.
a The monomers and feed ratios for the syntheses of nBSA-Z20 and nBSA-Z40. b The fluorescence images of major organs 24 h after the injection of nBSA-Z20 or nBSA-Z40 labeled with Alexa Fluor 647 (AF647). c Fluorescence microscopy images of kidney tissue co-stained with anti-ITGA8 antibody after nBSA-Z20 and nBSA-Z40 injection. This experiment was repeated independently three times with similar results. Scale bar = 50 μm. White arrows were used for colocalization analysis (d, e). d, e The colocalization analyses of mesangial cells (highly expressed ITGA8) and nBSA-Z20 (d) or nBSA-Z40 (e) (fluorescence images were shown in Fig. 5c). f, g Biodistribution of nNluc-Z20 (f) and nNluc-Z40 (g) tested by bioluminescence. Data are presented as mean ± s.d. and were analyzed by one-way ANOVA with Tukey’s multiple comparisons test. n = 3. h The integrated radiance, sizes, and ζ potentials of the major organs 24 h after the injection of AF647-labeled BSA, nBSA-Z20, nBSA-Z40, nBSA-Z30, nBSA-P1N4, nBSA-Z23, nBSA-Z39, or nBSA-N1P3. Sizes and ζ potentials are presented as mean ± s.d. n = 3. The n represents biologically independent replicates (fh). Source data are provided as a Source Data file.
Fig. 6
Fig. 6. nCAT-Z40 effectively reduced the cisplatin-induced acute kidney injury.
a Representative ex vivo fluorescence images of major organs from mice 24 h after tail-vein injection of nCAT-Z40 and catalase (CAT) labeled with Alexa Fluor 647. b Immunofluorescence images of kidney sections 24 h after the mice were injected with nCAT-Z40 and CAT labeled with Alexa Fluor 647. The tissue sections were stained for cell nuclei (blue) and nephrin (green). This experiment was repeated independently three times with similar results. Scale bar = 10 µm. c The dosing scheme for cisplatin-induced acute kidney injury (AKI) model and nCAT-Z40 treatment (Created in BioRender. Wang, L. (2025) https://BioRender.com/a96u763). d Body weights of mice on Day 3 in the cisplatin-induced AKI model. e Blood serum levels of blood urea nitrogen (BUN) in healthy mice and AKI mice treated with PBS, CAT, or nCAT-Z40. f Paller score of kidney tissue in healthy mice and AKI mice treated with PBS, CAT, or nCAT-Z40. g Dihydroethidium (DHE) fluorescence intensities in kidney sections on Day 3 of PBS, CAT, or nCAT-Z40 treatment of cisplatin-induced AKI. h Fluorescence images of DAPI and DHE-stained kidney tissues from healthy mice and AKI mice treated with PBS, CAT, or nCAT-Z40. This experiment was repeated independently two times with similar results. Scale bar = 20 μm. dg Data are presented as mean ± s.d. and were analyzed by one-way ANOVA with Tukey’s multiple comparisons test. n = 5. The n represents biologically independent replicates (dg). Source data are provided as a Source Data file.

Similar articles

Cited by

References

    1. Dilliard, S. A. & Siegwart, D. J. Passive, active and endogenous organ-targeted lipid and polymer nanoparticles for delivery of genetic drugs. Nat. Rev. Mater.8, 282–300 (2023). - PMC - PubMed
    1. Kim, J., Eygeris, Y., Ryals, R. C., Jozic, A. & Sahay, G. Strategies for non-viral vectors targeting organs beyond the liver. Nat. Nanotechnol.19, 428–447 (2023). - PubMed
    1. Liu, J., Zhou, Y., Lyu, Q., Yao, X. & Wang, W. Targeted protein delivery based on stimuli-triggered nanomedicine. Exploration4, 20230025 (2024). - PMC - PubMed
    1. Su, H., Rong, G., Li, L. & Cheng, Y. Subcellular targeting strategies for protein and peptide delivery. Adv. Drug. Deliver. Rev. 212, 10.1016/j.addr.2024.115387 (2024). - PubMed
    1. Cabral, H., Li, J., Miyata, K. & Kataoka, K. Controlling the biodistribution and clearance of nanomedicines. Nat. Rev. Bioeng.2, 214–232 (2024).

LinkOut - more resources