. 2025 Feb;9(2):214-224.
doi: 10.1038/s41559-024-02633-z. Epub 2025 Jan 21.

Insights from a century of data reveal global trends in ex situ living plant collections

Affiliations

Insights from a century of data reveal global trends in ex situ living plant collections

Ángela Cano et al. Nat Ecol Evol. 2025 Feb.

Abstract

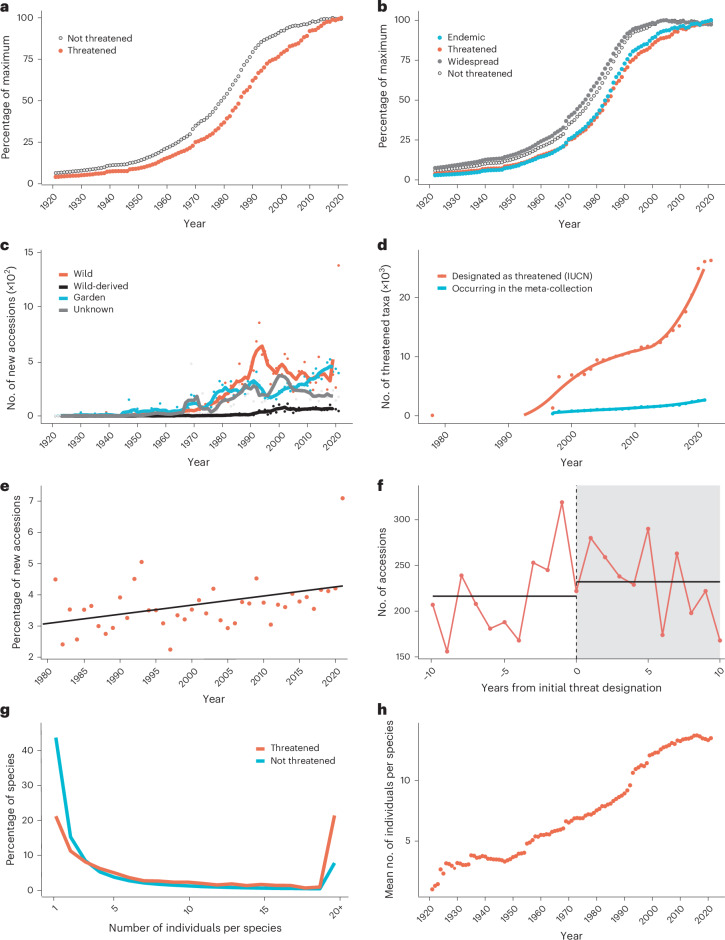
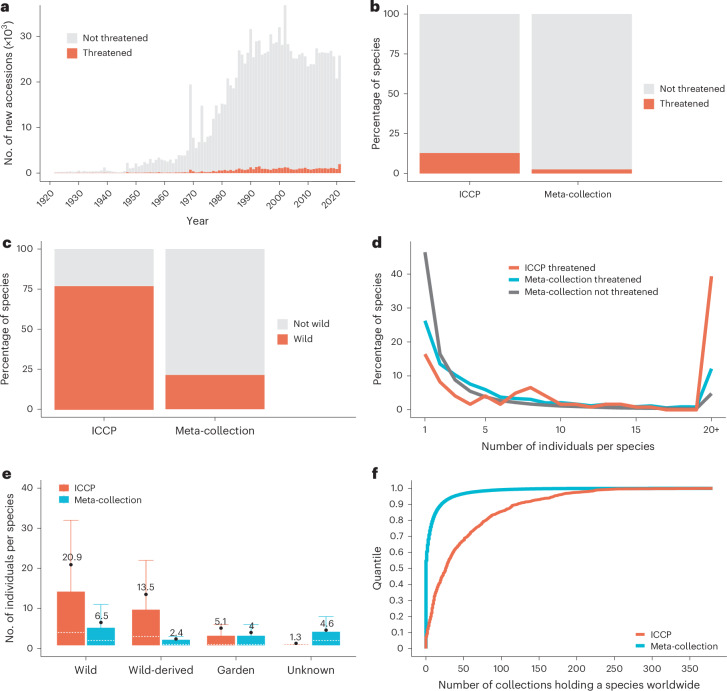
Ex situ living plant collections play a crucial role in providing nature-based solutions to twenty-first century global challenges. However, the complex dynamics of these artificial ecosystems are poorly quantified and understood, affecting biodiversity storage, conservation and utilization. To evaluate the management of ex situ plant diversity, we analysed a century of data comprising 2.2 million records, from a meta-collection currently holding ~500,000 accessions and 41% of global ex situ species diversity. Our study provides critical insights into the historical evolution, current state and future trajectory of global living collections. We reveal sigmoidal growth of a meta-collection that has reached capacity in both total accessions and total diversity, and identify intrinsic constraints on biodiversity management, including a median survival probability of 15 years. We explore the impact of external constraints and quantify the influence of the Convention on Biological Diversity, which we link to reduced acquisition of wild-origin and internationally sourced material by 44% and 38%, respectively. We further define the impact of these constraints on ex situ conservation but highlight targeted initiatives that successfully mitigate these challenges. Ultimately, our study underscores the urgent need for strategic prioritization and the re-evaluation of ex situ biodiversity management to achieve both scientific and conservation goals.


Conflict of interest statement

Competing interests: The authors declare no competing interests.

Figures

Fig. 1
Fig. 1. Dynamics of the meta-collection with respect to capacity, diversity and provenance.
a, Total number of accessions within the meta-collection over time (1921–2021) (black arrow denotes peak capacity reached in 2008; CBD marks the Convention on Biological Diversity coming into force in 1993). b, Turnover over time, with dotted line representing the net turnover as a 5 year rolling average (black arrow denotes first occurrence of net negative in 2009). c, A comparison of sigmoidal growth curves for accrual of accessions versus accrual of phylogenetic diversity (PD) (black arrows indicate no notable increase in PD over the past 30 years despite 25% increase in collection size). d, Changing proportions in provenance as a percentage of total accessions over time, with the line equating to a 5 year rolling mean (black arrow denotes point where proportion of wild accessions had reached its peak—peak wild—in 1995). e, Changing proportions in provenance among newly accessioned material, with the lines equating to a 5 year rolling mean (black arrow marks the CBD). f, Changing proportion of new accessions of native origin versus non-native origin, with the lines equating to a 5 year rolling mean (black arrow marks the CBD).
Fig. 2
Fig. 2. The dynamics of threatened plant collections.
a, Proportion of threatened versus non-threatened species within the meta-collection over time. b, Same as a with endemic versus widespread species overlayed for comparison. c, Number of new accessions of threatened species by provenance with lines equating to a 5 year rolling mean. d, Accumulation of species designated as threatened by the IUCN versus the accumulation of designated threatened species in the meta-collection (starting from the first appearance of digitally available IUCN Red List in 1978). e, Proportion of threatened plants accessioned relative to all new accessions in a given year. f, Rates of accessioning of threatened species in 10 years before designation versus 10 years after designation (year 0 is when a species was first designated as threatened). g, Number of individual plants per species for threatened versus non-threatened plants. h, Mean number of individual plants per threatened species over time.
Fig. 3
Fig. 3. The quantifiable signature of effective ex situ conservation using the International Conifer Conservation Programme as a case study.
a, Number of new accessions each year in the meta-collection grouped stacked into threatened and non-threatened species. bf, Comparison of existing plants in the meta-collection against existing plants in the International Conifer Conservation Programme (ICCP) by showing: the percentage of threatened species (b); the proportion of wild-origin taxa (c); the number of individual plants per threatened species in the ICCP and in the meta-collection versus non-threatened species in the meta-collection (d); the number of individual plants per species by provenance, with box plots depicting median (dotted line) and mean (filled circle with number), upper and lower quartile, whiskers, outliers not included (e); and sample quantiles of the number of global collections that threatened species are held in for the ICCP versus the meta-collection (f).
Fig. 4
Fig. 4. Kaplan–Meier survival curves as applied to the meta-collection.
The survival curves are shown as solid lines, with 95% confidence intervals (CI) (shaded regions); because of the size of the datasets and the high degree of confidence, the shaded CIs are often barely visible. The median survival probability (MSP) for each group is indicated by the dashed lines. af, Estimated MSP of: all accessions across the meta-collection, MSP = 15 yr (n = 1,018,769, CI = 15.3–15.4) (a); trees and non-trees, MSP = 20 and 15 yr, respectively (trees—n = 69,616, CI = 20.1–20.7; non-trees—n = 949,153, CI = 15.0–15.1) (b); endemic and widespread species, MSP = 15 yr for both (endemic—n = 153,107, CI = 15.6–15.9; widespread—n = 865,662, CI = 15.2–15.3) (c); threatened accessions and species restricted to plants that were accessioned between 1980 and 2021 (d) (the MSP times for threatened versus non-threatened accessions was 14 versus 12 years (threatened accessions—n = 35,664, CI = 13.9–14.3; non-threatened accessions—n = 840,750, CI = 11.8-11.9) and threatened versus non-threatened species was 16 versus 13 years (threatened species—n = 13647, CI = 15.7–16.6; non-threatened species—n = 447,561, CI = 12.7–12.9)); native and non-native species, MSP = 16 and 15 yr, respectively (native—n = 137,150, CI = 16.5–16.6; non-native—n = 944,351, CI = 15.0–15.1) (e); biological (species, subspecies, varieties and forma) and horticultural (cultivars and hybrids) taxa MSP = 16 and 14 yr, respectively (biological—n = 704,704, CI = 16.2–16.4; horticultural—n = 253771, CI = 14.2–14.4) (f).
Extended Data Fig. 1
Extended Data Fig. 1. Taxonomic diversity, extinction risk, and species genetic pool across the meta-collection, and its spread in historic capacity and geographic location.
a) Comparison of change over time in the proportional numbers of accessions, families, genera, and species, as well as phylogenetic diversity in the meta-collection; b) Change over time in the number of threatened species in the meta-collection by IUCN Red List categories; c) Historic maximum number of accessions in the fifty individual living plant collections. The different colours mirror the arrows in Supplementary Fig. 1 (red being collections decreasing in number of accessions, orange plateauing collections, and green growing collections); d) Geographic location of the fifty individual living plant collections that compose the meta-collection, where the diameter of the circles is proportional to their total amount of records.

References

    1. Mounce, R., Smith, P. & Brockington, S. Ex situ conservation of plant diversity in the world’s botanic gardens. Nat. Plants3, 795–802 (2017). - PubMed
    1. Wyse Jackson, P. & Sutherland, L. A. in Encyclopedia of Biodiversity (ed. Levin, S. A.) 504–521 (Elsevier, 2013).
    1. Speck, O. & Speck, T. Functional morphology of plants—a key to biomimetic applications. New Phytol.231, 950–956 (2021). - PubMed
    1. Carpenter, E. J. et al. Access to RNA-sequencing data from 1,173 plant species: the 1000 plant transcriptomes initiative (1KP). GigaScience8, giz126 (2019). - PMC - PubMed
    1. Lewin, H. A. et al. The Earth BioGenome Project 2020: starting the clock. Proc. Natl Acad. Sci. USA119, e2115635118 (2022). - PMC - PubMed

MeSH terms

LinkOut - more resources