. 2025 Feb;6(2):278-291.
doi: 10.1038/s43018-024-00902-1. Epub 2025 Jan 21.

Targeting BRCA1-deficient PARP inhibitor-resistant cells with nickases reveals nick resection as a cancer vulnerability

Affiliations

Targeting BRCA1-deficient PARP inhibitor-resistant cells with nickases reveals nick resection as a cancer vulnerability

Jenna M Whalen et al. Nat Cancer. 2025 Feb.

Abstract

Tumors lacking the BRCA1 and BRCA2 (BRCA) hereditary breast cancer genes display heightened sensitivity to anti-cancer treatments, such as inhibitors of poly (ADP-ribose) polymerase 1 (PARP1). However, when resistance develops, treatments are lacking. Using CRISPR technology, we discovered that enhancing homologous recombination through increased DNA end resection in BRCA1-deficient cells by loss of the 53BP1-Shieldin complex-which is associated with resistance to PARP inhibitors-also heightens sensitivity to DNA nicks. The sensitivity is caused by hyper-resection of nicks into extensive single-stranded regions that trigger cell death. Based on these findings and that nicks limit tumor formation in mice, we propose nickases as a tool for personalized medicine. Moreover, our findings indicate that restricting nick expansion is a critical function of the 53BP1-Shieldin complex.


Conflict of interest statement

Competing interests: Authors declare no competing interests. Inclusion & ethics statement: Each collaborator in this study has satisfied the authorship criteria set by Nature Portfolio journals, earning inclusion as an author. Their contributions to planning and performing the study were appropriately acknowledged. Collaborators established roles and responsibilities prior to initiating the research.

Figures
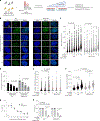
Extended Data Fig. 1 |
Extended Data Fig. 1 |. CRISPR-Cas9 experimental controls and immunofluoresent images for Fig 1.
A) Representative images for Rad51 IF (Fig. 1E) after induction of DSBs by Cas9. B) The percentage of RPE1 WT and BRCA1 KO cells with micronuclei (MN) 24 hours after Cas9-induced DSBs. Data represents the mean percentage ± SEM of three biological replicates. The arrow indicates MN. C) Quantification of γH2AX mean intensity at 24, 48, and 72 hours after Cas9-induced DSBs in RPE1 WT and BRCA1 KO. The data was normalized to 0 DSBs condition. Data represents the mean ± SEM of three biological replicates. Statistical analysis according to two-tailed Kruskal-Wallis with Dunn’s multiple comparison test. D) Representative images for DNAPK IF (Fig. 1F) after Cas9-incuded DSBs. E) Colony cell survival assay for RPE1 WT and BRCA1 KO cells (endogenous Cas9) after treatment with PARPi. Data represents the mean percentage ± SEM of survival across three biological replicates. Statistical analysis according to two-tailed Mann-Whitney. F) Cell survival assays for RPE1 WT and BRCA1 KO cells (endogenous Cas9) 5 days after Cas9-induced DSBs. Sensitivity was assessed by 96-well Cell-Titer Glo. Survival was normalized to 0 DSB control. Data represents the mean percentage ± SEM of survival across four biological replicates. Statistical analysis according to two-tailed Mann-Whitney. G) Schematic of experimental steps for transfecting sgRNAs and Cas9 by CRISPR-Max to induce DSBs and assessing nicks and sensitivity. H) Colony cell survival assay of RPE1 WT and BRCA1 KO cells (without endogenous Cas9) after treatment with PARPi. Data represents the mean percentage ± SEM of survival across three biological replicates. Statistical analysis according to unpaired t-test (two-tailed, unequal variance). I-K) Cell survival assays for RPE1 WT and BRCA1 KO cells transfected with (I) catalytically dead Cas9/sgRNA with targets, (J) active Cas9/sgRNA without a target, (K) active Cas9/sgRNA with targets. Survival was normalized to the control without Cas9 or sgRNA, but was otherwise treated with the same buffers. Data represents the mean percentage ± SEM of survival across three biological replicates. Statistical analysis according to two-tailed Mann-Whitney. L) The percentage of RPE1 WT and BRCA1 KO cells with micronuclei (MN) was assessed 24 hours after transfection of the catalytically dead Cas9 and sgRNA.
Extended Data Fig. 2 |
Extended Data Fig. 2 |. Cas9-H840A induced nicks sensitize BRCA deficient cells similar to Cas9-D10A as shown in Fig. 2, but nicks in either orientation do not increase MN formation.
A) Schematic of a nick translation assay used to detect the induction of nicks by Cas9-nickase. B-C) The percentage of RPE1 WT and BRCA1 KO cells with micronuclei (MN) was assessed 24 hours after transfection of (B) Cas9-nickase (D10A) and (C) Cas9-nickase (H840A) and sgRNAs with the indicated targets. Data represents the mean percentage ± SEM of three biological replicates. D) Colony cell survival assays for RPE1 WT and BRCA1 KO cells after nick induction by Cas9-nickase (H840A) and indicated sgRNAs. Survival was normalized to the 0 nick control. Data represents the mean percentage ± SEM of survival across four biological replicates. Statistical analysis according to unpaired t-test (two-tailed, unequal variance). E-G) Colony cell survival assay for (E) MDA-MB-436, (F) PEO1 and C4–2, and (G) HeLa cells after treatment with PARPi (Olaparib). Data represents the mean percentage ± SEM of survival across three biological replicates. Statistical analysis according to multiple unpaired t-test (two-tailed, unequal variance). H-I) Colony cell survival assays for (H) MDA-MB-436 and (I) PEO1 and C4–2 cells transfected with Cas9-nickase (H840A) and indicated sgRNAs 10–14 days after nick induction. Survival was normalized to the 0 nick control. Data represents the mean percentage ± SEM of survival across three biological replicates. Statistical analysis according to unpaired t-test (two-tailed, unequal variance).
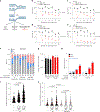
Extended Data Fig. 3 |
Extended Data Fig. 3 |. Nick sensitivity is not linked to replication and BRCA2 mutant cells are not further sensitized to nicks with the loss of 53BP1.
A-B) Colony cell survival assay for RPE1 WT and DKO cells after (A) treatment with PARPi and (B) transfection with Cas9/sgRNAs. Survival was normalized to the 0 DSB control. Data represents the mean percentage ± SEM of survival across three biological replicates. Statistical analysis according to two-tailed Mann-Whitney. C) A representative western blot analysis with indicated antibodies of lysates from C4–2/PEO1 cells expressing shRNA against non-silencing control (NSC), 53BP1–65, and 53BP1–66. D) Colony cell survival assays for PEO1 cells with sh53BP1 after Cas9-nickase (D10A) induced nicks. Survival was normalized to 0 nick control. Data represents the mean percentage ± SEM of survival. Statistical analysis according to Kruskal-Wallis with Dunn’s multiple comparisons test. E) A representative western blot analysis with indicated antibodies of lysates from HeLa and HeLa BRCA2 KO cells expressing shRNA against non-silencing control (NSC), 53BP1–65, and 53BP1–66. F) Colony cell survival assays for HeLa BRCA2 KO cells with sh53BP1 after Cas9-nickase (D10A) induced nicks. Survival was normalized to 0 nick control. Data represents the mean percentage ± SEM of survival across three biological replicates. Statistical analysis according to Kruskal-Wallis with Dunn’s multiple comparisons test. G-H) Cell cycle analysis in RPE1 (G) WT and (H) BRCA1 KO cells 24, 48, or 72 hours after induction of nicks or DSBs. Propidium iodine (PI) staining and FACs analysis was done. Data represents the mean percentage ± SEM of cells in each cell cycle phase across three biological replicates. I) Quantification of γH2AX mean intensity 24, 48, and 72 hours after Cas9-nickase (D10A) induced nicks in RPE1 WT and DKO cells. The data was normalized to 0 nicks control. Data represents the mean intensity ± SEM of three biological replicates. J-K) Two replicates for Fig. 3H. Percentage of apoptotic cells by FACS analysis after Annexin V/PI staining. Cells cultured with/without serum arrest cells in G1. Cells collected 72 hours after Cas9-nickase (D10A) induced nicks. Percent S phase cells at the time of nick induction is in green. L-M) Percentage of sub-G1 cells by PI stainig/FACS analysis. Cells were cultured with/without serum to arrest in G1. Cells were collected 72 hours after Cas9-nickase (D10A) nick induction. Graphs represent two independent experiments.
Extended Data Fig. 4 |
Extended Data Fig. 4 |. Nick induced BRCA1 and 53BP1 foci are dependent on ATM/γH2AX and ATM, respectively.
A) Quantification of γH2AX mean intensity in RPE1 WT and BRCA1 KO cells 24 hours after Cas9-induced DSBs with and without 10uM ATMi treatment. Data represents the mean intensity ± SEM of three biological replicates. Statistical analysis according to two-tailed Mann-Whitney test. B-C) Quantification of BRCA1 foci in RPE1 WT cells 24 hours after (B) Cas9-nickase (D10A) induced nicks or (C) Cas9-induced DSBs with and without 10uM ATMi treatment. Data represents the mean foci ± SEM of three biological replicates. Statistical analysis according to two-tailed Mann-Whitney test. D) Western blot analysis with indicated antibodies of lysates from RPE1 WT cells expressing small hairpin RNA (shRNA) against non-silencing control (NSC) and γH2AX. E-F) Quantification of BRCA1 foci in RPE1 WT cells after γH2AX knockdown and 24 hours after (E) Cas9-nickase (D10A) induced nicks or (F) Cas9-induced DSBs. Data represents the mean foci ± SEM of three biological replicates. Statistical analysis according to two-tailed Mann-Whitney test. G) Western blot analysis with indicated antibodies of lysates from RPE1 WT cells expressing small hairpin RNA (shRNA) against non-silencing control (NSC), MDC1–51, and MDC1–53. H) Quantification of BRCA1 foci in RPE1 WT cells after MDC1 knockdown and 24 hours after Cas9-nickase (D10A) induced nicks or Cas9-induced DSBs. Data represents the mean foci ± SEM of three biological replicates. I-J) Quantification of 53BP1 foci in RPE1 WT cells 24 hours after (I) Cas9-nickase (D10A) induced nicks or (J) Cas9-induced DSBs with and without 10uM ATMi treatment. Data represents the mean foci ± SEM of three biological replicates. K-L) Quantification of 53BP1 foci in RPE1 WT cells after γH2AX knockdown and 24 hours after (K) Cas9-nickase (D10A) induced nicks or (L) Cas9-induced DSBs. Data represents the mean foci ± SEM of three biological replicates. Statistical analysis according to two-tailed Mann-Whitney test. M) Quantification of 53BP1 foci in RPE1 WT cells after MDC1 knockdown and 24 hours after Cas9-nickase (D10A) induced nicks or Cas9-induced DSBs. Data represents the mean foci ± SEM of three biological replicates.
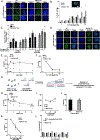
Extended Data Fig. 5 |
Extended Data Fig. 5 |. Sensitivity of a single nick target site does not depend on the genomic location and 53BP1 loss alone results in nick sensitivity.
A) Colony cell survival assays for RPE1 WT and DKO cells transfected with Cas9-nickase (D10A) and sgRNAs. Survival was normalized to 0 nick control. Data represents mean percentage ± SEM of survival across three biological replicates. Statistical analysis according to Kruskal-Wallis with Dunn’s multiple comparisons test. B) Quantification of cell death at 24, 48, and 72 hours after Cas9-nickase (D10A) induced nicks in RPE1 WT and DKO cells using a fluorescent based TUNEL assay. Data represents mean intensity ± SEM across three biological replicates. Statistical analysis according to Kruskal-Wallis with Dunn’s multiple comparison test. C) Quantification of cell death at 24, 48, and 72 hours after Cas9-nickase (D10A) induced nicks in RPE1 WT and BRCA1 KO cells using a fluorescent based TUNEL assay. The data was normalized to the 0 DSBs condition. Data represents mean ± SEM of three biological replicates. Statistical analysis according to Kruskal-Wallis with Dunn’s multiple comparison test. D) Colony cell survival assays for RPE1 WT and 53BP1 KO cells transfected with Cas9-nickase (D10A) and sgRNAs. Survival was normalized to 0 nick control. Data represents the mean percentage ± SEM of survival across three biological replicates. Statistical analysis according to unpaired t-test (two-tailed, unequal variance). E-F) Colony cell survival assays for (E) C4–2 and (F) HeLa cells with 53BP1 knockdown after transfection with Cas9-nickase (D10A) and sgRNAs. Survival was normalized to the 0 nick control. Data represents mean percentage ± SEM of survival across three biological replicates. Statistical analysis according to Kruskal-Wallis with Dunn’s multiple comparisons test. G) Quantification of RPA70 mean intensity 24 hours after Cas9-nickase (D10A) induced nicks. Data represents mean intensity ± SEM of three biological replicates. Statistical analysis according to Kruskal-Wallis with Dunn’s multiple comparison test. H) Quantification of ATM/ATR phosphorylation mean intensity for RPE1 WT and BRCA1 KO cells 24 hours after Cas9-nickase (D10A) induced nicks. Data represents mean intensity ± SEM across 3 biological replicates. Statistical analysis according to Kruskal-Wallis with Dunn’s multiple comparison test. I) Quantification of mean ssDNA intensity for RPE1 WT and BRCA1 KO cells following 24 hours of BrdU pre-labeling and Cas9-nickase (D10A) induced nicks. Data represents mean intensity ± SEM of three biological replicates. Statistical analysis according to Kruskal-Wallis with Dunn’s multiple comparison test.
Extended Data Fig. 6 |
Extended Data Fig. 6 |. Additional supporting data for Fig. 4 on the mechanism of nick expansion and sensitivity.
A) Quantification of mean ssDNA intensity for RPE1 DKO cells after CtIP depletion following 24 hours of BrdU pre-labeling and Cas9-nickase (D10A)-induced nicks at 100 target sites. Data represents the mean intensity ± SEM of three biological replicates. Statistical analysis according to Kruskal-Wallis with Dunn’s multiple comparison test. B) A representative western blot analysis with the indicated antibodies of lysates from RPE1 DKO cells expressing siRNA against non-silencing control and CtIP. C) Colony cell survival assays for RPE1 DKO cells after CtIP depletion 10–14 days after Cas9-nickase (D10A) induced nicks at the indicated number of target sites. Survival was normalized to the 0 nick control. Data represents the mean percentage ± SEM of survival across three biological replicates. Statistical analysis according to multiple unpaired t-test (two-tailed, unequal variance). D-E) Colony cell survival assays for RPE1 WT and DKO cells 10–14 days after Cas9-nickase (D10A)-induced nicks (D) and treatment with DMSO or 15uM PFM01 and (E) and treatment with DMSO or 10uM Mirin for the duration of the 10–14 days. Survival was normalized to the 0 DSB control. Data represents the mean percentage ± SEM of survival across three biological replicates. F) Colony cell survival assays for RPE1 DKO cells with Exo1i [10uM] 10–14 days after transfection with Cas9-nickase (D10A) and sgRNAs with the indicated number of target sites. Survival was normalized to a 0 nick control. Data represents the mean percentage ± SEM of survival across three biological replicates. G) Western blot analysis with indicated antibodies of lysates from RPE1 DKO cells transfected with a plasmid containing 53BP1-Myc. H) Quantification of GFP mean fluorescence after treatment with CPT [10uM] for 1 hour in RPE1 DKO cells with and without transfection of a plasmid containing SHLD2-FHA-GFP. Data represents the mean intensity ± SEM of three biological replicates. Statistical analysis according to two-tailed Mann-Whitney. I) Colony cell survival assay for RPE1 DKO cells with and without +53BP1-Myc and +SHLD2-FHA-GFP after treatment with the indicated concentrations of PARPi (Olaparib). Data represents the mean percentage ± SEM of survival across three biological replicates. Statistical analysis according to unpaired t-test (two-tailed, unequal variance).
Extended Data Fig. 7 |
Extended Data Fig. 7 |. Additional supporting data for Fig. 5.
A-C) Cell survival assays for RPE1 WT and DKO cells 5 days after addition of the drug (A) SN-38, (B) neocarzinostatin (NCS), and (C) 5-(Hydroxymethyl)-2’-deoxyuridine (hMDU). Sensitivity was assessed by 96-well Cell-Titer Glo. Data represents the mean percentage ± SEM of survival for each dot across at least three biological replicates. Statistical analysis according to multiple unpaired t-test (two-tailed, unequal variance). D) Western blot analysis with the indicated antibodies of lysates from MDA-MB-436 cells. Graph shows relative 53BP1 protein. E) Colony cell survival assays for MDA-MB-436 cells with transfected Cas9-nickase (H840A) and indicated sgRNAs. Survival was normalized to the control that did not have the sgRNA or Cas9-nickase added, but was otherwise treated with all the same buffers. Data represents the mean percentage ± SEM of survival across three biological replicates. Statistical analysis according to Kruskal-Wallis with Dunn’s multiple comparison test. F) Quantification of mean ssDNA intensity for indicated MDA-MB-436 cells following BrdU pre-labeling and nick induction using Cas9-nicase (D10A). Data represents the mean intensity ± SEM. Statistical analysis according to Kruskal-Wallis with Dunn’s multiple comparison test. G-H) Colony cell survival assay for BR5 and BR5-R1 cells (G) treated with PARPi (Olaparib) and (H) after transfection with Cas9-nickase (D10A) and indicated sgRNAs. Data represents the mean percentage ± SEM of survival across three biological replicates. Statistical analysis according to multiple unpaired t-test (two-tailed, unequal variance). I) Quantification of mean ssDNA intensity for BR5 and BR5-R1 cells following 24 hours of BrdU pre-labeling and 24 hours after Cas9-nickase (D10A)-induced nicks. The data was normalized to the 0 nicks condition. Data represents the mean ± SEM of three biological replicates. J) Second replicate for Fig. 5F. Tumor formation in female NOD scid mice after induction of nicks in MDA-MB-436 RR1 cells. Each group contained 6 mice that were injected in the mammary fat-pad with 1-million MDA-MB-436 RR1 cells 24 hours after nick induction. Tumor formation and size was monitored for 48 days. Data represents the mean percentage ± SEM of tumor size (mm3) in the 6 mice in the group each day. Statistical analysis according to two-tailed Mann-Whitney test.
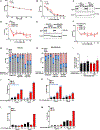
Fig. 1 |
Fig. 1 |. Cas9-induced DSBs do not uniquely target BRCA deficiency.
a, Schematic of experimental steps for transfecting sgRNAs by RNAiMax lipofectamine to induce DSBs and assess γH2AX signal and colony survival. b, Example images of γH2AX foci (green) and Hoechst (blue) in RPE1 wild-type (WT) and BRCA1 KO cell lines with the indicated number of DSB target sites. Scale bar, 2 μm. c, Quantification of γH2AX mean intensity across a range of Cas9-induced DSBs. Data represent the mean ± s.e.m. of three biological replicates. Statistical analysis by Kruskal–Wallis with Dunn’s multiple comparison test. d, Twenty-four hours after Cas9-induced DSBs at 0, 13 or 100 target sites, 10 μM EdU was added for 30 min, followed by Click-It. The untreated (UN) control had no transfection buffers. Data represent the mean ± s.e.m. of three biological replicates. Statistical analysis by Kruskal–Wallis with Dunn’s multiple comparison test. e, Quantification of RAD51 foci per nucleus 24 h after Cas9-induced DSBs at 0, 13 or 100 target sites. Data represent the mean ± s.e.m. of three biological replicates. Statistical analysis by Kruskal–Wallis with Dunn’s multiple comparison test. f, Quantification of chromatin-bound (CB)-DNAPK mean intensity 24 h after Cas9-induced DSBs at 0, 13 or 100 target sites. Data represents the mean ± s.e.m. of three biological replicates. Statistical analysis by Kruskal–Wallis with Dunn’s multiple comparison test. g, Colony cell survival assays for RPE1 WT and BRCA1 KO cells with endogenous Cas9 10–14 days after Cas9-induced DSBs at the indicated number of target sites. Survival was normalized to the 0 DSBs control. Data represents the mean ± s.e.m. of four biological replicates. Statistical analysis by two-tailed Mann–Whitney test. h, Colony cell survival assays for RPE1 WT and BRCA1 KO cells with endogenous Cas9 10–14 days after Cas9-induced DSBs at 0 or 4 target sites and treatment with DMSO or 2 μM DNAPKi for the duration of the 10–14 days. Survival was normalized to the 0 DSB control. Data represents the mean ± s.e.m. of three biological replicates. Statistical analysis by Kruskal–Wallis with Dunn’s multiple comparison test.
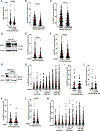
Fig. 2 |
Fig. 2 |. Cas9-induced nicks do uniquely target BRCA deficiency.
a, Schematic of experimental steps for transfecting sgRNAs and Cas9-nickase by CRISPR-Max to induce nicks and assess subsequent nicks and sensitivity. b, Example images of BrdU (indicating nicks) (red) and Hoechst staining (blue) in RPE1 WT and BRCA1 KO cell lines with the indicated number of nicks (D10A) induced. Scale bar, 2 μm. c, Quantification of BrdU (indicating nicks) mean intensity in RPE1 WT and BRCA1 KO cell lines 24 h after Cas9-nickase (D10A)-induced nicks at 0, 1, 13 or 100 target sites. Data represents the mean ± s.e.m. of three biological replicates. A negative control (No Pol) condition without the polymerase was to show low background level of signal. Statistical analysis by Kruskal–Wallis with Dunn’s multiple comparison test. d, Twenty-four hours after Cas9-nickase (D10A)-induced nicks at 0 or 100 target sites, 10 μM EdU was added for 30 min, followed by Click-It. The untreated control had no transfection buffers. Data represent the mean ± s.e.m. of three biological replicates. e, Colony cell survival assays for RPE1 WT and BRCA1 KO cells transfected with Cas9-nickase (D10A) 10–14 days after induced nicks at 0 or 4 target sites and treatment with DMSO or 2 μM DNAPKi for the duration of the 10–14 days. Survival was normalized to the 0 nick control. Data represents the mean ± s.e.m. of four biological replicates. fi, Colony cell survival assays for RPE1 (f), MDA-MB-436 (g), PEO1 and C4–2 (h) and HeLa (i) cells transfected with Cas9-nickase (D10A) and indicated sgRNAs 10–14 days after nick induction. Survival was normalized to the 0 nick control. Data represent the mean ± s.e.m. of at least three biological replicates. Statistical analysis determined by Mann–Whitney test (fh) and unpaired t-test (two-tailed, unequal variance) (i). jl, Colony cell survival assays for MDA-MB-436 (j), PEO1 and C4–2 (k) and HeLa (l) cells transfected with Cas9 and indicated sgRNAs 10–14 days after DSB induction. Survival was normalized to the 0 DSB control. Data represent mean ± s.e.m. of at least three biological replicates.
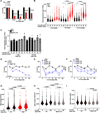
Fig. 3 |
Fig. 3 |. Nick sensitivity is not linked to replication.
a, Schematic of a nick upstream of a replication fork becoming a DSB after replication. be, Colony cell survival assays for RPE1 (b) BRCA1 and 53BP1 double knockout (DKO), (c) BRCA1 and SHLD3 DKO, (d) BRCA1 and REV7 DKO and (e) BRCA1 and SHLD2 DKO cells transfected with Cas9-nickase (D10A) and indicated sgRNAs 10–14 days after nick induction. Survival was normalized to the 0 nick control. Data represents the mean percentage ± s.e.m. of survival for each dot across at least three biological replicates. Statistical analysis by Kruskal–Wallis with Dunn’s multiple comparison test. f, Cell cycle analysis in RPE1 DKO cells 24, 48 or 72 h after Cas9-nickase (D10A)-induced nicks or Cas9-induced DSBs at 0 or 100 target sites. Propidium iodine (PI) staining was done, followed by FACS analysis. Data represent the mean ± s.e.m. of three biological replicates. g, Twenty-four hours after Cas9-nickase (D10A)-induced nicks at 0 or 100 target sites, 10 μM EdU was added for 30 min followed by Click-It kit. The untreated control had no transfection buffers. Data represent the mean ± s.e.m. of three biological replicates. h, Percentage of apoptotic cells with FACS analysis after annexin V/propidium iodine staining. Cells were either cultured with or without serum to induce serum starving and arrest in G1 phase. Cells were collected 72 h after Cas9-nickase (D10A)-induced nicks at 0 or 100 target sites. Percentage of S phase cells at the time of nick induction is denoted above each bar. Representative graph with two more replicates in Extended Data Fig. 3j,k. i, Quantification of BRCA1 foci in RPE1 WT cells 24 h after Cas9-nickase (D10A)-induced nicks at 0 or 100 target sites. Data represent the mean ± s.e.m. across three biological replicates. Statistical analysis by Kruskal–Wallis with Dunn’s multiple comparison test. j, Quantification of 53BP1 foci in RPE1 WT and BRCA1 KO cells 24 h after Cas9-nickase (D10A)-induced nicks at 0 or 100 target sites. Data represent the mean ± s.e.m. across three biological replicates. Statistical analysis by Kruskal–Wallis with Dunn’s multiple comparison test.
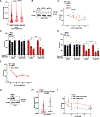
Fig. 4 |
Fig. 4 |. Unregulated nick resection generates hypersensitivity.
a, Quantification of cell death at 24, 48 and 72 h after Cas9-nickase (D10A)-induced nicks at 0 or 100 target sites in RPE1 WT and DKO cells using a fluorescence-based TUNEL assay. Data were normalized to the 0 nicks condition. Data represent the mean ± s.e.m. of three biological replicates. b, Schematic of the resection machinery expanding a nick into a ssDNA gap. c, Quantification of ATM/ATR phosphorylation mean intensity 24 h after Cas9-nickase (D10A)-induced nicks at the indicated target sites. Data represent the mean ± s.e.m. of three biological replicates. Statistical analysis by Kruskal–Wallis with Dunn’s multiple comparison test. d, Schematic and quantification of mean ssDNA intensity for RPE1 WT and DKO cells following 24 h of BrdU prelabeling and Cas9-nickase (D10A)-induced nicks. Data represent the mean ± s.e.m. of three biological replicates. Statistical analysis by Kruskal–Wallis with Dunn’s multiple comparison test. e, A representative western blot analysis with indicated antibodies of lysates from RPE1 DKO cells expressing small hairpin RNA (shRNA) against non-silencing control (NSC), CtIP-A and CtIP-B. f,g, Colony cell survival assays for RPE1 DKO cells after CtIP knockdown (f) and BLMi (10 μM or 50 μM) (g) and 10–14 days after transfection with Cas9-nickase (D10A) and sgRNAs. Survival was normalized to a 0 nick control. Data represent the mean ± s.e.m. of three biological replicates. Statistical analysis by multiple unpaired t-test (two-tailed, unequal variance). h, Colony cell survival assays for RPE1 DKO cells after transfection of plasmids containing 53BP1–MYC or SHLD2-FHA–GFP 10–14 days after Cas9-nickase (D10A)-induced nicks. Survival was normalized to the 0 nick control. Data represent the mean± s.e.m. of three biological replicates. Statistical analysis by multiple unpaired t-test (two-tailed, unequal variance). i, Colony cell survival assays for RPE1 DKO cells after CtIP knockdown and transfection with Cas9-nickase (D10A) fused to t7-exonuclease and indicated sgRNAs 10–14 days after nicks were induced. Survival was normalized to a 0 nick control. Data represent the mean ± s.e.m. of three biological replicates. n.s., not significant.
Fig. 5 |
Fig. 5 |. Nickases selectively target PARPi-resistant BRCA1 mutant cells with restored resection.
a,b, Colony cell survival assay for KB1P-G3 (BRCA1 KO) and KB1P-177.a5 (DKO) cells after treatment with PARPi (olaparib) (a) and after transfection with Cas9-nickase (D10A) and indicated sgRNAs 10–14 days after nicks were induced (b). Data represent the mean± s.e.m. of three biological replicates. Statistical analysis by multiple unpaired t-test (two-tailed, unequal variance). c,d, Colony cell survival assay for MDA-MB-436 PARPi-resistant RR1 versus MDA-MB-436 vector or BRCA1 restored lines after treatment with a PARPi (olaparib) (c) and (d) after transfection with Cas9-nickase (D10A) and indicated sgRNAs 10–14 days after nicks were induced (d). Data represent the mean ± s.e.m. of sthree biological replicates. Statistical analysis by multiple unpaired t-test (two-tailed, unequal variance) (c) and Kruskal–Wallis with Dunn’s multiple comparison test (d). e, Schematic of mouse tumor formation after nick induction. f, Tumor formation in female NOD scid mice after induction of nicks at 0 or 100 target sites in MDA-MB-436 RR1 cells. Each group contained 6 mice that were injected in the mammary fat pad with MDA-MB-436 RR1 cells (1 × 10⁶) 24 h after nick induction. Tumor formation and size were monitored for 44 days. Data represent the mean ± s.e.m. of 6 mice. Statistical analysis by two-tailed Mann–Whitney test. g, Model showing that in the absence of the 53BP1–Shieldin complex and BRCA1 extensive resection occurs at a nick leading to cell death. This hyper-resection of nicks can be used as a therapy to kill PARPi-resistant cancer lacking the 53BP1–Shielin complex.

References

    1. Jackson SP & Bartek J The DNA-damage response in human biology and disease. Nature 461, 1071–1078 (2009). - PMC - PubMed
    1. Futreal PA et al. BRCA1 mutations in primary breast and ovarian carcinomas. Science 266, 120–122 (1994). - PubMed
    1. Silver DP & Livingston DM Mechanisms of BRCA1 tumor suppression. Cancer Discov. 2, 679–684 (2012). - PMC - PubMed
    1. Bryant HE et al. Specific killing of BRCA2-deficient tumours with inhibitors of poly(ADP-ribose) polymerase. Nature 434, 913–917 (2005). - PubMed
    1. Farmer H et al. Targeting the DNA repair defect in BRCA mutant cells as a therapeutic strategy. Nature 434, 917–921 (2005). - PubMed

MeSH terms

Substances