. 2025 Mar;44(5):1512-1539.
doi: 10.1038/s44318-025-00365-9. Epub 2025 Jan 21.

The Shu complex interacts with the replicative helicase to prevent mutations and aberrant recombination

Affiliations

The Shu complex interacts with the replicative helicase to prevent mutations and aberrant recombination

Adeola A Fagunloye et al. EMBO J. 2025 Mar.

Abstract

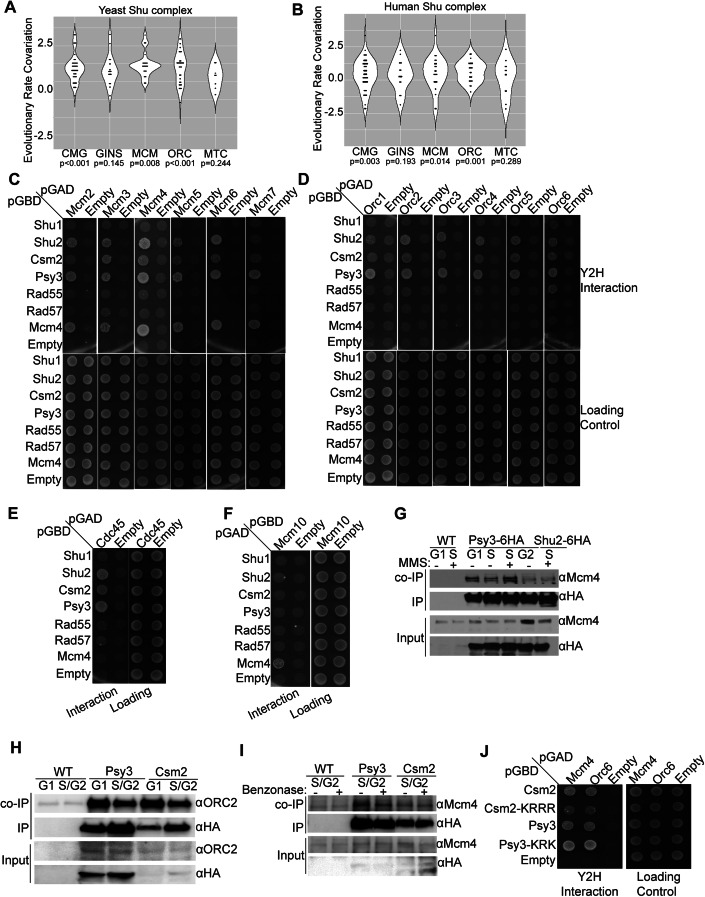
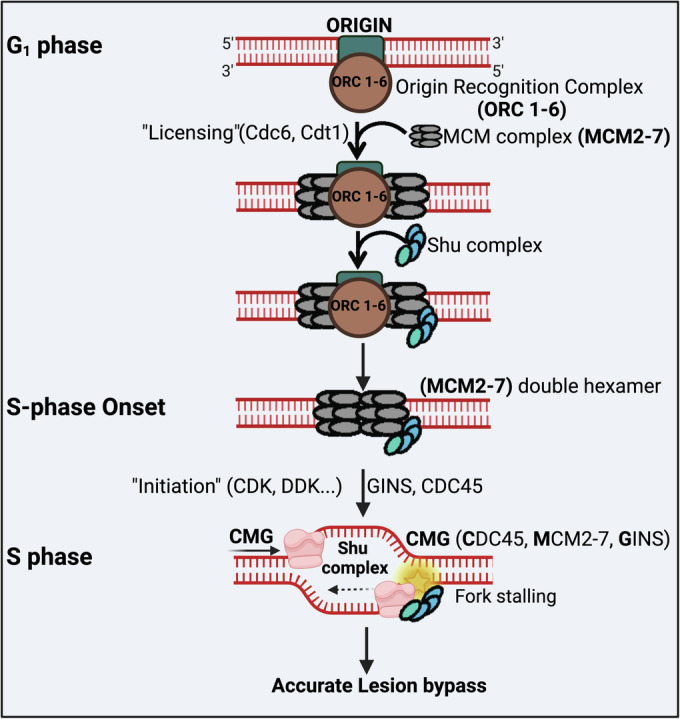
Homologous recombination (HR) is important for DNA damage tolerance during replication. The yeast Shu complex, a conserved homologous recombination factor, prevents replication-associated mutagenesis. Here we examine how yeast cells require the Shu complex for coping with MMS-induced lesions during DNA replication. We find that Csm2, a subunit of the Shu complex, binds to autonomous-replicating sequences (ARS) in yeast. Further evolutionary studies reveal that the yeast and human Shu complexes have co-evolved with specific replication-initiation factors. The connection between the Shu complex and replication is underlined by the finding that the Shu complex interacts with the ORC and MCM complexes. For example, the Shu complex interacts, independent of other HR proteins, with the replication initiation complexes through the N-terminus of Psy3. Lastly, we show interactions between the Shu complex and the replication initiation complexes are essential for resistance to DNA damage, to prevent mutations and aberrant recombination events. In our model, the Shu complex interacts with the replication machinery to enable error-free bypass of DNA damage.

Keywords: DNA Damage Tolerance; DNA Replication; Homologous Recombination; RAD51; Shu Complex.


Conflict of interest statement

Disclosure and competing interests statement. The authors declare no competing interests.

Figures

Figure 1
Figure 1. Shu complex member, Csm2 is enriched at the replication origin and cell cycle regulated.
(A) IGV Illustration of binding sites obtained by ChIPseq of Rad55 and Csm2 on Chromosome 7. Using the genome browser, all peaks obtained by ChIPseq were visualized and aligned to the yeast genome. As an example, we visualized the binding sites of Rad55 and Csm2 on Chromosome 7. (B) overlap of Csm2 to annotated ARS regions. Exact p-value: p = 0.0346. (C) Overlap of joint peaks of RAD55 and Csm2 with ARS sites. Exact p-value: p = 0.0275. (D) Overlap of Csm2 peaks with DNA Pol II binding sites. DNA Pol II sites are obtained from previous publications and indicate regions of replication fork stalls or slow-downs (Paeschke et al, 2011). High DNA Pol II binding reflects a long occupancy of the replisome at that site and can be correlated to replication pausing. Exact p-value: p = <0.0001. (E) Overlap of RAD55 peaks with Pol II binding sites with red lines depicting p-value threshold delineating overlap between Rad55 and Pol2 sites. Exact p-value: p = <0.0001. (BE) Bioinformatics analyses demonstrating the overlap of genomic features with the ChIPseq peaks. Significance is assessed by a genome-wide permutation test. Bars represent the normal distribution of 10,000 random genomes. Based on ChIPseq peaks, we calculated the overlap of ChIPseq binding sites to other genomic features. P-values denote the statistical significance of the enrichment of experimental-determined peaks to random genome sets. The location of the red lines indicates the significance; the further to the right the line is, the lower the calculated p-value is. (F) Csm2 expression increases during S/G2 and then plateaus. Csm2-6HA expressing cells were either untreated (asynchronous, AS) or cell cycle arrested in G1 with α-factor. The α-factor arrested cells were subsequently released into fresh YPD medium (0 min) and grown for 120 min. Protein samples from the indicated time points were analyzed by western blot for Csm2 (anti-HA), the G2/M cyclin, Clb2, (anti-Clb2), or a loading control, GAPDH (anti-GAPDH). Quantification from three experiments and the mean was calculated from SEM. The cell cycle stage was analyzed FACS. Asterisks indicate statistical significance in comparison with Clb2 and Csm2 in 60 and 80 min under the same experimental conditions using a student’s t-test. Statistical comparisons are indicated as *p  <  0.05 and **p  <  0.01; where (60 min: Csm2-6HA vs Clb2 p = 0.004 and 80 min: Csm2-6HA vs Clb2 exact p = 0.0332. (G) Psy3, Shu1, and Shu2 proteins are expressed throughout the cell cycle. Psy3, Shu1, and Shu2 6HA-expressing cells were either untreated (asynchronous, AS) or cell cycle arrested in G1 with α-factor. Protein samples from the indicated time points were analyzed by western blot for Psy3, Shu1, and Shu2 (anti-HA), the G2/M cyclin, Clb2, (anti-Clb2), or a loading control, Kar2 (anti-Kar2). Quantification from three experiments is shown. The error bar represents the mean ± SEM. Source data are available online for this figure.
Figure 2
Figure 2. Csm2 enrichment at ARS sites depends on DNA binding and its interaction with Rad55 and is reduced upon MMS damage or when abasic sites accumulate.
(A) ChIP and qPCR of Csm2 and the DNA binding mutant, Csm2-KRRR. qPCRs were performed at three ARS sites (ARS216, ARS306, ARS305) and one control (ChrIV IG). Csm2 vs. Csm2KRRR ARS216 p = 0.012298, ARS305 p = 0.049031, ARS306 p = 0.016581, and ChrIV IG p = 0.588828. (B) ChIP and qPCR of Csm2 untreated or treated with 0.02% MMS. qPCRs were performed at three ARS sites (ARS216, ARS306, ARS305) and one control (ChrIV IG). Csm2 vs. Csm2+MMS ARS216 p = 0.025306, ARS305 p = 0.019218, ARS306 p = 0.045902, ChrIV IG p = 0.213139. (C) ChIP and qPCR of Csm2 and Csm2 apn1Δ apn2Δ. qPCRs were performed at three ARS sites (ARS216, ARS306, ARS305) and one control (ChrIV IG). Csm2 vs. Csm2 apn1Δ apn2Δ ARS216 p = 0.013517, ARS305 p = 0.010209, ARS306 p = 0.066661, ChrIV IG p = 0.073803. (D) ChIP and qPCR of Csm2 and Csm2-F46A. qPCRs were performed at three ARS sites (ARS216, ARS306, ARS305) and one control (ChrIV IG). Csm2 vs.Csm2-F46A ARS216 p = 0.011423, ARS305 p = 0.016839, ARS306 p = 0.013847, ChrIV IG p = 0.097323. (E) ChIP and qPCR of RAD55 and RAD55 Csm2-F46A. qPCRs were performed at three ARS sites (ARS216, ARS306, ARS305) and one control (ChrIV IG). RAD55 vs. RAD55 Csm2-F46A ARS216 p = 0.017328, ARS305 p = 0.001765, ARS306 p = 0.000594, ChrIV IG p = 0.123547. All plotted results were based on the average of the ChIP/Input ratio of at least three independent experiments ± SEM. Significance was calculated based on a one-sided Student’s t-test. Asterisks indicate statistical significance in comparison with wild-type cells under the same experimental conditions. *p < 0.05, **p < 0.01, ***p < 0.001 and ns = not statistically significant. Source data are available online for this figure.
Figure 3
Figure 3. The Shu complex co-evolves and physically interacts with the ORC and MCM complex members.
(A) The yeast Shu complex has evolutionary rates that correlate with CMG (n = 44, p < 0.001), MCM (n = 24, p = 0.008), and ORC (n = 24, p < 0.001) complexes at levels higher than expected by chance when compared to a null distribution of 1000 permutations. Sample sizes for non-significant comparisons were GINS n = 16, MTC n = 12, and RAD51 n = 12. Violin plots show higher evolutionary rate correlations between the yeast Shu complex and the replication initiation complexes when compared to the genome-wide background correlation, which is expected to be zero. Each dot represents co-evolution between two proteins compared to 1000 permuted nulls, the higher the correlation coefficient, the more significant the co-evolution. Significance is assessed by genome-wide permutation test contrasting observed Shu correlations against random protein sets. (B) Same as (A), except the human Shu complex was analyzed against human protein complexes. Violin plots show the same complexes CMG (N = 48, p = 0.003), MCM (N = 24, p = 0.014), and ORC (N = 24, p = 0.001) have significantly high ERC compared to a null distribution of 1000 permutations. (C) Shu complex members Shu2, Csm2, and Psy3 exhibit a Y2H interaction with Mcm complex members (MCM2-7). Y2H experiment examining Shu complex (Shu1, Shu2, Csm2, Psy3) interaction with MCM complex members compared to the canonical Rad51 paralogs, Rad55-Rad57, and MCM complex member Mcm4. (D) Shu2 and Psy3 exhibit a Y2H interaction with ORC complex members (ORC1-6). Y2H experiment examining Shu complex interaction with ORC complex members compared to Rad55-Rad57 and MCM complex member Mcm4. (E) Shu complex members Shu2, Csm2, and Psy3 exhibit a Y2H interaction with Cdc45. Y2H experiment examining Shu complex interaction with Cdc45 compared to Rad55-Rad57 and Mcm4. (F) Mcm10 does not exhibit a Y2H interaction with the Shu complex. Y2H experiment examining Shu complex interaction with Mcm10 compared to Rad55-Rad57 and MCM complex member Mcm4. For the Y2H experiments, yeast with the indicated plasmids were grown in SC-L-W, plated on SC-L-W-H medium, and incubated for 2 days at 30 °C. Growth on SC-L-W-H is indicative of a Y2H interaction, and SC-L-W is used as a loading control. Empty vectors are negative controls, and Mcm4 is a positive control. All experiments were done in triplicate. (G) Psy3 co-IPs with Mcm4 predominantly during the G1/S phase with or without MMS. Untagged wild-type, Psy3-6HA, or Shu2-6HA expressing cells were either arrested in G1, and S phase cells released from α-factor arrest (+/−0.03% MMS for 40 min) or arrested in G2/M with nocodazole. Psy3 is IP using HA antibodies and then runs on an SDS-PAGE gel. (H) Psy3 and Csm2 co-IP ORC2 during G1 and S/G2 phase cells. Untagged wild-type, Psy3-6HA, or Csm2-6HA expressing cells were arrested in G1 with α-factor or released from α-factor into S/G2. Psy3 and Csm2 was IP using HA antibodies and then run on an SDS-PAGE gel. Co-IP with ORC2 was accessed using anti-ORC2 antibodies, and immunoprecipitation was accessed using anti-HA antibodies. The input represents 5% of the total. (I) Co-IP experiments of the parental untagged strain, Psy3-6HA, and Csm2-6HA in the presence or absence of benzonase. Cells expressing Psy3-6HA, Csm2-6HA, or the untagged strain were arrested in G1 with α-factor and then released into fresh YPD medium for ~45 min, which correlated with S/G2 cell cycle phase. S phase was verified by the budding index. Psy3 or Csm2 were immunoprecipitated with αHA antibodies in the presence or absence of benzonase (25 U) and the protein was run on an SDS-PAGE gel and blotted for Mcm4 (αMcm4; co-IP) or HA (αHA; IP). (J) Csm2 and Psy3 Y2H interaction with Mcm4 and Orc6 are DNA binding independent. Y2H analysis of Csm2, Psy3, and the DNA binding mutants, Csm2-KRRR and Psy3-KRK with Mcm4 and Orc6. Yeast with the indicated plasmids were grown in SC-L-W, plated on SC-L-W-H medium, and incubated for 2 days at 30 °C. Source data are available online for this figure.
Figure 4
Figure 4. The Shu complex interaction with the ORC and MCM complex is independent of Rad51, Rad52, and Rad55 but dependent on Psy3.
(A) Shu complex Y2H interaction with ORC complex members (ORC1 and ORC2) is independent of RAD51 and RAD55. Y2H experiment examining Shu complex (Shu1, Shu2, Csm2, Psy3) interaction with ORC1 and ORC2 transformed into Y2H strain with either rad51∆ or rad55∆ knocked out. (B) Same as (A) except the Mcm4 in a pGAD vector was analyzed. (C) ChIP and qPCR of Csm2 and Csm2 rad51Δ. qPCRs were performed at three ARS sites (ARS302, ARS306, ARS305) and one control (ChrIV IG) Csm2 vs Csm2 rad51Δ ARS216 p = 0.464805, ARS305 p = 0.394199, ARS306 p = 0.331189, ChrIV IG p = 0.039181. (D) ChIP and qPCR of Csm2 and Csm2 rad52Δ. qPCRs were performed at three ARS sites (ARS302, ARS306, ARS305) and one control (ChrIV IG). Csm2 vs Csm2 rad52Δ ARS216 p = 0.303514, ARS305 p = 0.313981, ARS306 p = 0.230426, ChrIV IG p = 0.201505. (E) Shu2 and Csm2 interaction with Mcm4 and Orc6 is dependent on PSY3. Y2H experiment examining Shu complex interaction with Mcm4 and Orc6 when each of the Shu complex members are deleted in the Y2H strain (shu1∆, shu2∆, csm2∆, psy3∆). For the Y2H experiments, yeast with the indicated plasmids were grown in SC-L-W, plated on SC-L-W-H medium, and incubated for 2–3 days at 30 °C. Growth on SC-L-W-H is indicative of a Y2H interaction and SC-L-W is used as a loading control. All experiments were done in triplicate. (F) ChIP and qPCR of Csm2 and Csm2 psy3Δ. qPCRs were performed at three ARS sites (ARS302, ARS306, ARS305) and one control (ChrIV IG). Csm2 vs Csm2 psy3Δ ARS216 p = 0.017880, ARS305 p = 0.016139, ARS306 p = 0.019552 and ChrIV IG p = 0.053302. For the ChIP experiments, all plotted results were based on the average of the ChIP/Input ratio of at least three independent experiments ± SEM. Significance was calculated based on a one-sided Student’s t-test. Asterisks indicate statistical significance in comparison with wild-type cells under the same experimental conditions. *p  <  0.05 and ns = not statistically significant. (G) Western blot of Csm2 and Shu2 protein levels in WT and psy3∆ cells. Protein was isolated by TCA precipitation from untagged, WT or psy3∆ cells expressing 6HA-tagged Csm2 or Shu2. Csm2 and Shu2 protein levels were assessed by western blot (αHA) or for equal protein loading (αKar2). Source data are available online for this figure.
Figure 5
Figure 5. Rad51 and Rad52 exhibit a strong Y2H interaction with Mcm4 that is dependent on the Shu complex protein, Psy3.
(A) Rad51 and Rad52 exhibit a strong Y2H interaction with Mcm4 and a weak interaction with Mcm5 but not Mcm2, Orc4, or Orc6. (B) Rad51 and Rad52 Y2H interaction with Mcm4 is Psy3-dependent. Y2H analysis of Mcm4, and Orc6, with Rad51 and Rad52 transformed in either WT or in a psy3∆ yeast cell (PJ69-4α). (C) Rad55 Y2H interaction with Orc6 is modestly reduced upon PSY3 deletion. The Y2H experiment examining Rad55 interaction with Orc6 transformed into Y2H strain with either psy3∆ or csm2∆ knocked out. Yeast with the indicated plasmids were grown in SC-L-W, plated on SC-L-W-H medium, and incubated for 2–3 days at 30 °C. All experiments were done in triplicate. Source data are available online for this figure.
Figure 6
Figure 6. The conserved N-terminus of Psy3 mediates Shu complex interaction with Mcm4 and Orc6.
(A) The structure of the Shu complex (Shu1- pink, Shu2-yellow, Csm2-blue, Psy3-green) PDB: 5XYN, where Psy3 solvent-exposed residues outside of the Shu complex protein interactions, are highlighted (Robert and Gouet, 2014). (B) Weblogo showing the conservation of the N-terminus of Psy3, amino acids 1–30 (Crooks et al, 2004). (C) Mutation in the N-terminus of Psy3 results in loss of Mcm4 and Orc6 Y2H interactions but does not disrupt its interactions with the other Shu complex members, Csm2 and Shu1. Psy3 wild-type (WT) or the indicated psy3 mutant with either Mcm4, Csm2, Shu1, or Orc6 was transformed into the Y2H strain (PJ69-4α). All experiments were done in triplicate. (D) Psy3 N-terminus mutants are sensitive to MMS. PSY3 disrupted cells were transformed with a wild-type PSY3 expressing plasmid or a plasmid containing the indicated PSY3 N-terminal mutants. Equal cell numbers of the indicated strains were five-fold serial diluted onto rich medium (YPD; 0% MMS) or rich medium with MMS (0.01%, 0.02%, or 0.03%). The plates were grown at 30 °C for 2 days and photographed. The experiment was performed in triplicate. (E) Spontaneous and MMS-induced mutation rates at the CAN1 locus were measured in WT, empty, and psy3-Y10A, transformed in psy3∆. Psy3–Y10A expressing cells exhibit an elevated mutation rate in a canavanine mutagenesis assay. Exact p values (empty: untreated vs. treated p = <0.0001, psy3-Y10A: untreated vs. treated p = <0.000, treated: empty vs. psy3-Y10A p = 0.0015, treated: WT vs. empty p = <0.0001, and treated: WT vs. psy3-Y10A p = <0.0001). The mean value and SD from three independent experiments are plotted as error bars. Significance was determined by Tukey’s multiple comparisons test, where ** represents p < 0.0015 and **** represents p < 0.0001. (F) Schematic of direct repeat recombination (DRR). This assay involves two disrupted leu2 genes, each containing a distinct restriction site, EcoR1 and BsteII separated by an intervening URA3 gene. Reversion to LEU+ can be achieved via two distinct pathways. The Rad51-dependent gene conversion (GC) pathway leads to the restoration of LEU+ alongside the retention of the URA3 marker, producing URA3 + LEU2+ recombinants. Alternatively, the Rad51-independent single-strand annealing (SSA) pathway restores LEU+ while resulting in the loss of the URA3 gene, yielding URA3- LEU2+ recombinants. The DRR assay, therefore, provides a precise measure of recombination events by distinguishing between these mechanistically distinct repair pathways. (G) WT, psy3Δ or psy3-Y10A expressing cells harboring a direct repeat HR reporter (leu2-ΔEcoRI::URA3::leu2-ΔBstEII) were tested for spontaneous rates of GC and SSA and upon 0.0003% MMS exposure as described. Exact p values (SSA: empty-MMS vs. empty+MMS p =≤ 0.0001, GC vs. SSA: psy3 Y10A + MMS p =≤ 0.0001, SSA: WT-MMS vs. psy3-Y10A-MMS p = ≤0.0001, SSA: psy3-Y10A-MMS vs. psy3-Y10A + MMS p = ≤0.0001, SSA: empty+MMS vs. psy3-Y10A + MMS p = ≤0.0001, SSA: WT + MMS vs. psy3-Y10A + MMS p = ≤0.0001). Nine independent colonies were measured for each experiment and the mean value and SEM from three experiments (horizontal bar) were plotted. Significance was determined by the Tukey test where **** represents p ≤ 0.0001. Source data are available online for this figure.
Figure 7
Figure 7. Model of Shu complex function to bypass replicative damage by interacting with the replication machinery.
During G1, the Origin Recognition Complex (ORC), consisting of ORC1-6 (green and brown ovals), is loaded onto the replication origin. Subsequently, the “licensing” factors Cdc6 and Cdt1 are recruited. The MCM complex, consisting of MCM2-7 (gray ovals) is recruited and a second MCM complex is loaded by the licensing factors Cdc6 and Cdt1. The Shu complex (blue and green ovals) is recruited to the replication origin through an interaction between the Shu complex member, Psy3, and the ORC complex. Subsequently, The Shu complex interacts with the MCM complex through Psy3 and recruits the other HR machinery, Rad51 and Rad52. During the S phase, the MCM complex is activated by the CDK/DDK, and the Shu complex interacts with the replication fork and the CMG helicase (consisting of Cdc45, MCM complex, and GINS), via Mcm4 to enable bypass of the replication fork blocking lesions (i.e., abasic sites). The Shu complex interaction with the replication machinery enables a Rad51-mediated template switch and subsequent gap repair. The figure is created with www.biorender.com.
Figure EV1
Figure EV1. Csm2, Rad55, and Rad52 significantly overlap at the same DNA binding regions by ChIP seq.
(A) Five-fold serial dilution of the parental wild-type strain and strains expressing either Csm2-6HA or Rad55-9MYC on rich YPD medium or YPD medium containing the indicated concentration of MMS. (B) Genome-wide correlation of the Csm2 peaks with the RAD55 peaks. Exact p-value: p = < 0.0001. (C) Genome-wide correlation of the RAD55 peaks with the ARS sites. Exact p-value: p = 0.36. (D) Genome-wide correlation of the Csm2 peaks with the RAD52 peaks (Costantino and Koshland, 2018). Exact p-value: p = < 0.0001. (E) Genome-wide correlation of the RAD55 peaks with the RAD52 peaks (Costantino and Koshland, 2018). Exact p-value: p = < 0.0001. (BE) Significance is assessed by genome-wide permutation test (F) IGV Genome Browser screenshot of genome-wide Csm2, RAD55, RAD52, (Costantino and Koshland, 2018), MCM2-7 binding sites at ChrII:611,265-613,215 (Lee et al, 2021). ARS database is from OriDB, produced in Saccer1. Source data are available online for this figure.
Figure EV2
Figure EV2. Csm2 and Psy3 steady-state protein levels are maintained upon MMS exposure.
(A) Csm2 and Psy3 steady-state protein levels are not increased upon MMS exposure. Csm2-6HA or Psy3-6HA expressing strains were exposed to the indicated dose of MMS for one hour and then protein levels were accessed by western blot using αHA or αKar2 antibodies. Kar2 was used as a loading control. (B) Csm2 and Psy3 steady-state protein levels remain constant over time after 0.03% MMS exposure. Csm2-6HA or Psy3-6HA expressing strains were exposed to 0.03% MMS for the indicated amount of time (45, 60, or 120 min) and then protein levels were accessed by western blot using αHA or αKar2 antibodies. Kar2 was used as a loading control. Source data are available online for this figure.
Figure EV3
Figure EV3. Unlike Rad55 or Mcm4, Csm2 enrichment at ARS sites is reduced upon DNA damage.
(A) ChIP and qPCR of Csm2-6HA untreated or treated for 2 h with 100 mM HU. Exact p-value: ARS216 p = 0.007797, ARS305 p = 0.001494, ARS306 p = 0.006935, and ChrIV IG p = 0.464314. (B) ChIP and qPCR of Csm2-6HA untreated or treated for 2 h with 20 ng/µL bleomycin. Exact p-value: ARS216 p = 0.002339, ARS305 p = 0.001465, ARS306 p = 0.003030, ChrIV IG p = 0.164196. (C) ChIP and qPCR of RAD55-9MYC untreated or treated for 2 h with 0.02% MMS. Exact p-value: ARS216 p = 0.163698, ARS305 p = 0.106164, ARS306 p = 0.051302, and ChrIV IG p = 0.307960. (D) ChIP and qPCR of MCM4 untreated or treated for 2 h with 100 mM HU. Exact p-value: ARS216 p = 0.386663, ARS305 p = 0.295602, ARS306 p = 0.089571 and ChrIV IG p = 0.327584. (E) ChIP and qPCR of MCM4 untreated or treated for 2 h with 20 ng/µL bleomycin. Exact p-value: ARS216 p = 0.280850, ARS305 p = 0.087874, ARS306 p = 0.188565 and ChrIV IG p = 0.446871. For all experiments, qPCRs were performed at three ARS sites (ARS302, ARS306, ARS305) and one control (ChrIV IG). All plotted results were based on the ChIP/Input ratio average of at least three independent experiments ± SEM. Significance was calculated based on a one-sided Student’s t-test. Asterisks indicate statistical significance in comparison with wild-type cells under the same experimental conditions. *p  <  0.05, **p  <  0.01 and ns = not statistically significant. Source data are available online for this figure.
Figure EV4
Figure EV4. Mcm7 Y2H interaction with the Shu complex is independent of RAD51 or RAD55.
Shu complex Y2H interaction with MCM complex member (Mcm7) is independent of RAD51 and RAD55. Y2H experiment examining Shu complex (Shu1, Shu2, Csm2, Psy3) interaction with Mcm7 transformed in Y2H strain with either rad51∆ or rad55∆ knocked out. Yeast with the indicated plasmids were grown in SC-L-W, plated on SC-L-W-H medium, and incubated for 2–3 days at 30 °C. Empty vectors are negative controls. Growth is indicative of a Y2H interaction and SC-L-W is used as a loading control. All experiments were done in triplicate. Source data are available online for this figure.
Figure EV5
Figure EV5. Psy3 sequence alignment from 36 fungi species.
Sequence alignment of Shu complex member, Psy3, from the indicated 36 fungi species (Larkin et al, 2007). Invariant residues are shown in red boxes, and similar residues are shown in red text and outlined in blue. The predicted protein folding based on the S. cerevisiae structure (PDB: 5XYN) (Zhang et al, 2017) is shown above. The figure was made with ESPript3 (Robert and Gouet, 2014).

References

    1. Bailis JM, Luche DD, Hunter T, Forsburg SL (2008) Minichromosome maintenance proteins interact with checkpoint and recombination proteins to promote s-phase genome stability. Mol Cell Biol 28:1724–1738 - PMC - PubMed
    1. Ball LG, Zhang K, Cobb JA, Boone C, Xiao W (2009) The yeast Shu complex couples error-free post-replication repair to homologous recombination. Mol Microbiol 73:89–102 - PubMed
    1. Bauerschmidt C, Pollok S, Kremmer E, Nasheuer H-P, Grosse F (2007) Interactions of human Cdc45 with the Mcm2-7 complex, the GINS complex, and DNA polymerases delta and epsilon during S phase. Genes Cells 12:745–758 - PubMed
    1. Bochman ML, Schwacha A (2009) The Mcm complex: unwinding the mechanism of a replicative helicase. Microbiol Mol Biol Rev 73:652–683 - PMC - PubMed
    1. Böhm S, Szakal B, Herken BW, Sullivan MR, Mihalevic MJ, Kabbinavar FF, Branzei D, Clark NL, Bernstein KA (2016) The budding yeast ubiquitin protease ubp7 is a novel component involved in S phase progression. J Biol Chem 291:4442–4452 - PMC - PubMed

LinkOut - more resources